What is a KPI?
A Key Performance Indicator is a measurable value that demonstrates how effectively a company is achieving key business objectives.
- Organizations use KPIs at multiple levels to evaluate their success at reaching targets. High-level KPIs – Focus on the overall performance of the enterprise
- Low-level KPIs – Focus on processes in departments such as sales, marketing or a call center.
What makes a KPI effective?
KPIs give executives the chance to communicate the mission and focus of the organization to investors, team members, and other stakeholders. As KPIs filter through the organization, they must grab employees’ attention to make sure that everyone is moving together in the right direction and delivering value to the business.
KPIs vary depending on your business and industry
Depending on the type of business and industry, some of the KPIS are as listed:
- Net profit
- Net promoter score
- Customer engagement
- Customer complaints
- Market share
- Share of voice
- Carbon footprint
- Supply chain miles
- Waste recycling rate
- Employee satisfaction
- Staff churn
- Return on investment (ROI)

Always use the SMART criteria.
Specific – Measurable – Attainable – Relevant – Time-bound.
Defining Your KPIs
Here are a few examples:
- Finance – Working capital, Operating cash flow, Return on equity, Quick ratio, Debt to equity ratio, Inventory turnover, Accounts receivable turnover, Gross profit margin
- Marketing – Customer acquisition cost, Conversion rate of a particular channel, Percentage of leads generated from a particular channel, Customer Churn, Dormant customers, Average spend per customer
- Healthcare – Inpatient mortality rate, Bed turnover, Readmission rate, Average length of stay, Patient satisfaction, Total operating margin, Average cost per discharge, Cash receipt to bad debt, Claims denial rate
- Retail – Gross margin (as a percentage of selling price), Inventory turnover, Sell-through percentage, Average sales per transaction, Percentage of total stock not displayed
Business goals can be measured :
- Identify the problem area by Product, R&D related KPI metrics.
- Drill Down that by breaking down your core business goals into a much more specific metric.
- Make a Data model for Your Data.
Current Decision Making
Where the company is currently not making its decisions based on data, or not collecting the right data.
- What are the data sources?
- Predict the complexity of your data model
- Tools to prepare, manage and analyze data (BI solution)
Do this by breaking each KPI into its data components, asking questions like: what do I need to count, what do I need to aggregate, which filters need to apply? For each of these questions you have to know which the data sources are being used and where the tables coming from.
Make sure you are using the right tools, such as a BI tool that has built-in data connectors, to prepare and join data accurately easily.
- Make Simple Dashboards that are Accurate and interactive.
Closing
Always look for insights you can achieve with the data that the business never thought of asking.
Examples of common departmental KPIs
These examples illustrate KPIs for several different departments.
Sales

Sales Growth
Analyze the pace at which your organization’s sales revenue is growing and use that information in strategic decision-making.
Marketing
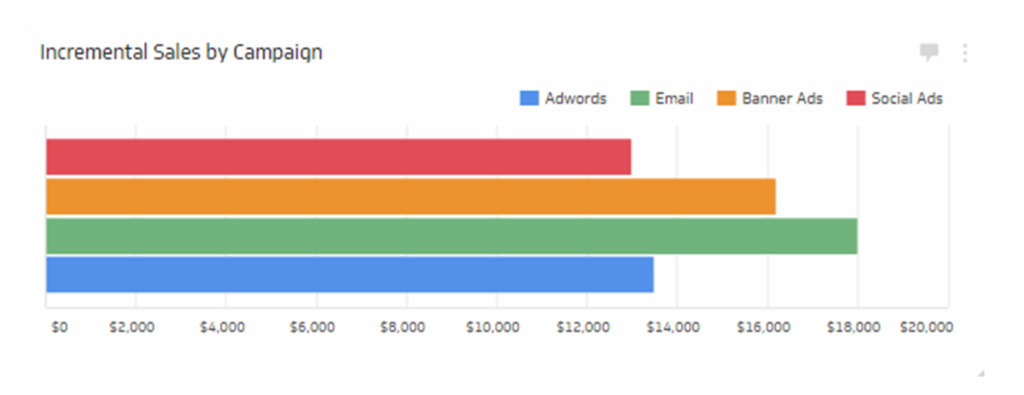
Incremental Sales
Measures how effective your marketing campaigns are at generating increased revenue and sales. This marketing KPI highlights the importance of the relationship between marketing and sales for your organization.
Financial
Working Capital
Measures your organization’s financial health by analyzing readily available resources that could be used to meet any short-term obligations.
Benefits of using Key Performance Indicators:
Track and analyze asset information for smart decision making.
- Increase in profit,
- Measuring Popularity,
- Identifying trends,
- Customer Response,
- To assess performance of current state,
- To determine whether future state has been achieved or whether further action required,
- To identify whether business objectives have been achieved,
- To judge the quality of the requirements gathered.
FAQ’s
What are KPIs in Business Intelligence?
KPIs in BI are quantifiable metrics used to measure the performance of various aspects of a business, such as sales, marketing, finance, and operations. These indicators help organizations gauge their progress towards strategic goals and make informed decisions based on data analysis.
Why are KPIs important for Business Intelligence?
KPIs provide valuable insights into the health and performance of a business. By tracking relevant metrics, organizations can identify trends, detect anomalies, and uncover areas for improvement. This data-driven approach enables informed decision-making, leading to better strategic planning and resource allocation.
How do you choose the right KPIs for Business Intelligence?
Selecting the right KPIs involves aligning them with your business objectives and priorities. Begin by identifying the key areas you want to measure and then determine which metrics best reflect performance in those areas. Consider factors such as relevance, measurability, achievability, and timeliness when choosing KPIs.
What are some common KPIs used in Business Intelligence?
Common KPIs in BI include metrics such as revenue growth, customer acquisition cost (CAC), customer lifetime value (CLV), churn rate, profitability margins, return on investment (ROI), market share, customer satisfaction scores (CSAT), and employee productivity metrics like sales per employee or efficiency ratios.

Abhishek Sharma
Website Developer and SEO Specialist
Abhishek Sharma is a skilled Website Developer, UI Developer, and SEO Specialist, proficient in managing, designing, and developing websites. He excels in creating visually appealing, user-friendly interfaces while optimizing websites for superior search engine performance and online visibility.