Why Business Dashboard
Business dashboards give real-time insight into important metrics and business critical KPIs. This important information works as a fuel for the business and enables business users to take the right course of action at any given point, take data driven decisions and drive business towards its goals.
Use data to drive success
Every car needs a driver (unlike self driven cars). A skilled driver is aware about the car’s capabilities and knows how to extract the best performance from the car. Similarly many drivers also known as business users drive a business. The performance of business is defined by the awareness, knowledge and skills of these users. Profitability of any business is directly proportional to the knowledge and proactivity of its users to implement that knowledge on daily basis. Just like car’s dashboard, a business dashboard also known as business intelligence dashboards informs its users about the current state of their business. The speed at which the business is running, targets achieved vs target set, operational performance, man-power requirements, sales and marketing performance, profits, losses and informed predictions. Present day business dashboards are capable enough to drive business in the right direction and provide highly accurate information gathered from multiple systems and creating a roadmap for the future.
Types of Business Dashboards
Business intelligence dashboards present data in visual formats, enabling users to grasp insights quickly
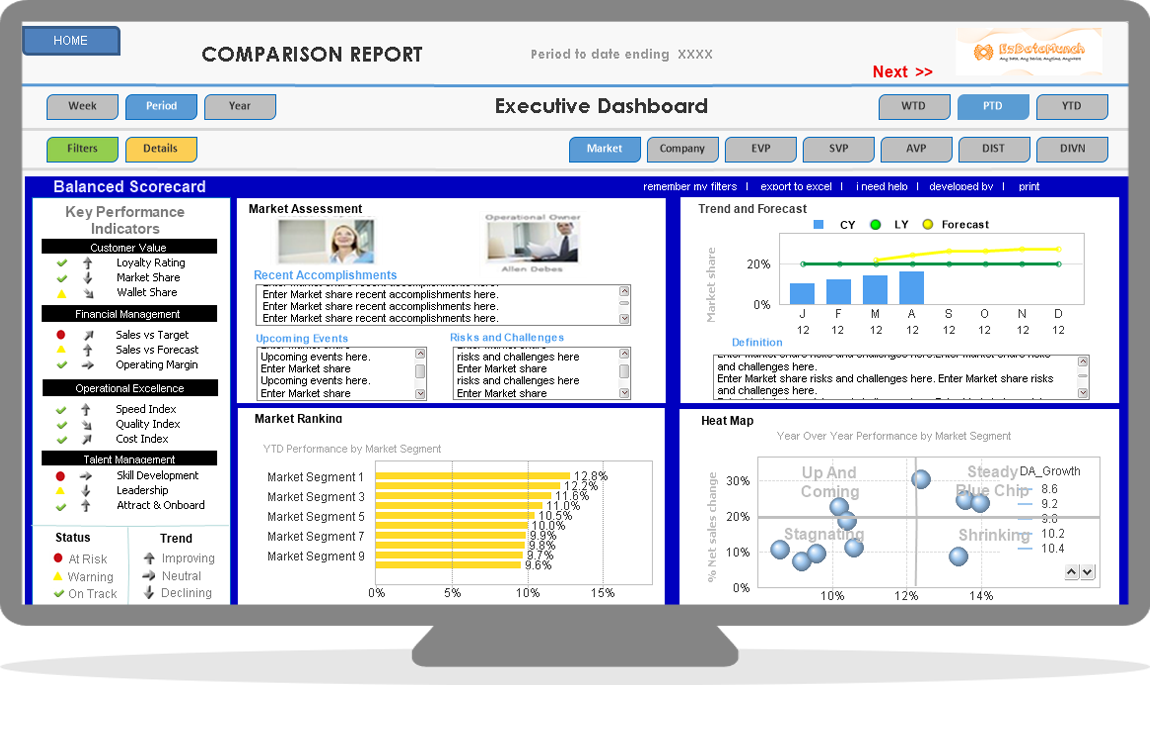
Executive Dashboard
Executive dashboards gives an overview of business that is quick, real-time and easy to understand. Just what executives need.
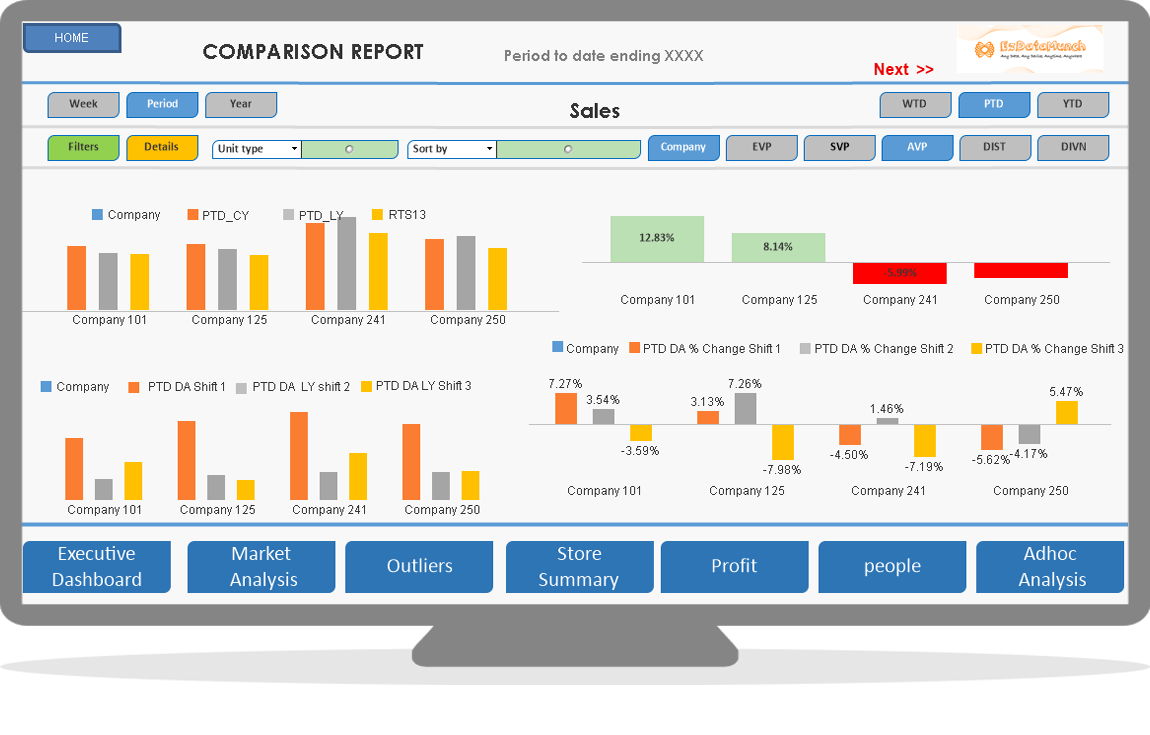
Sales Dashboard
Sales dashboard assist sales team to track and improve their performance.
Profit Dashboard
Profit dashboard showcases profit generated from multiple locations. Understand trends that are impacting profit.
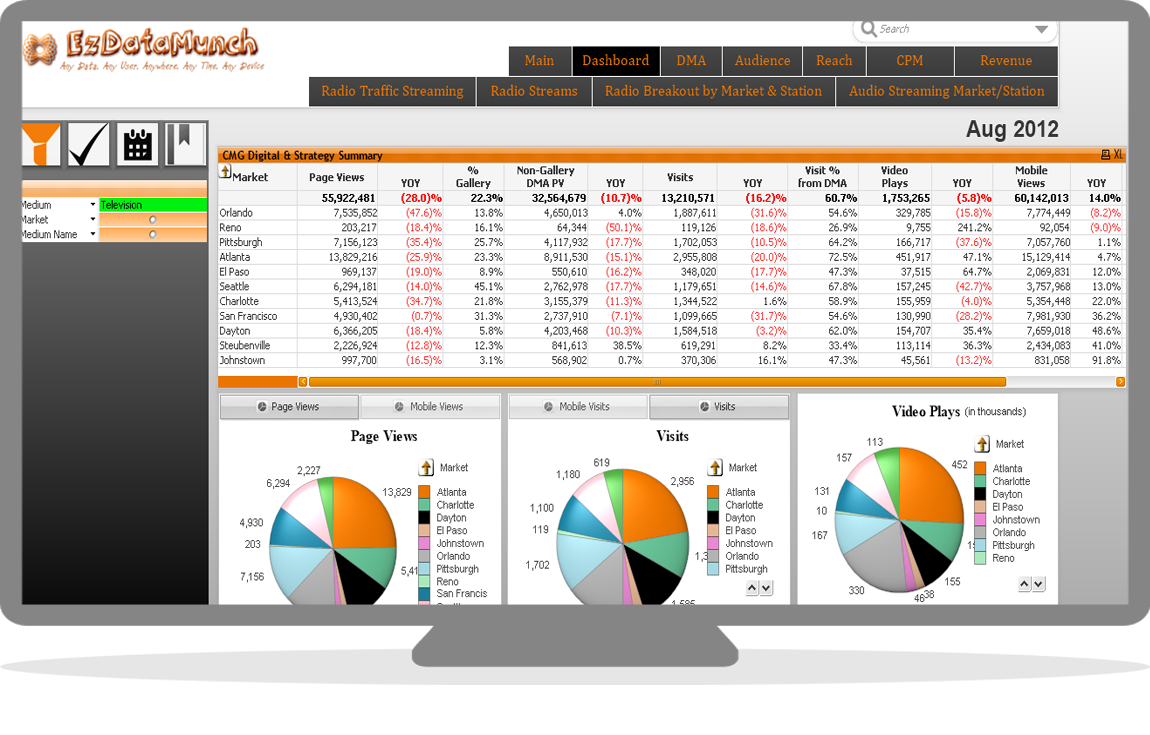
Digital Marketing Dashboards
This dashboard helps in tracking marketing campaigns, drive ROI from campaigns and improve marketing capability.
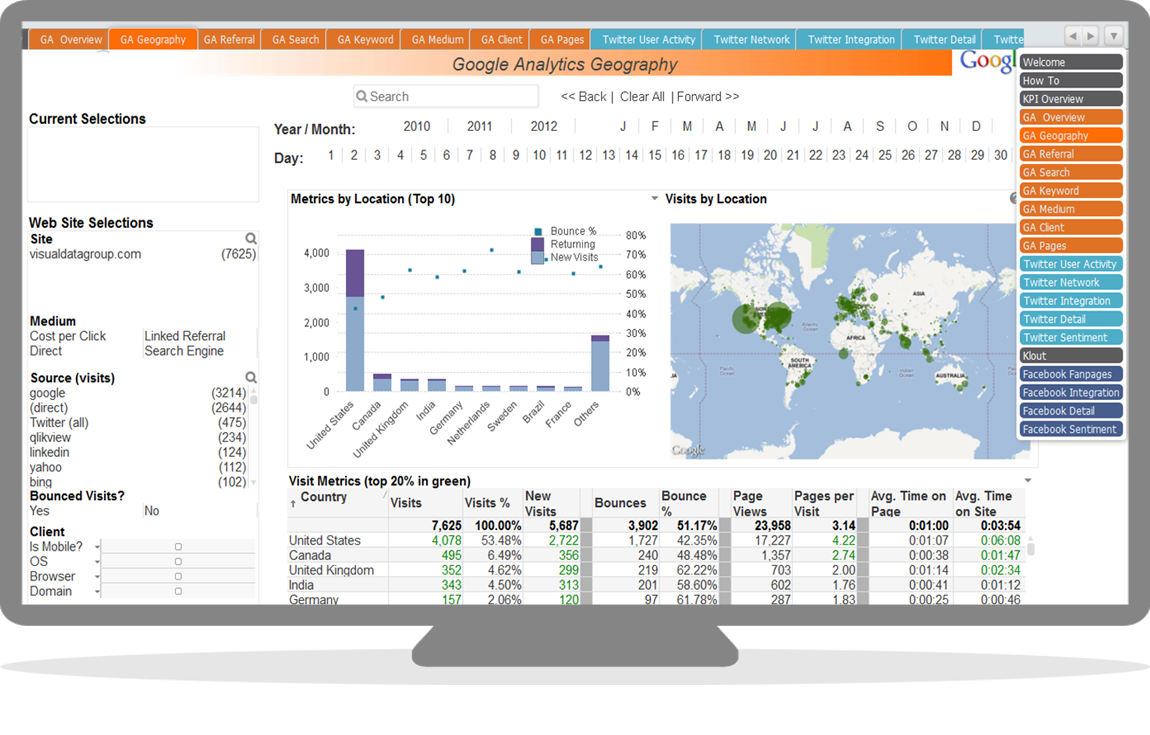
Social Media Dashboard
Track your social media traffic and understand online trend pertaining to your business.
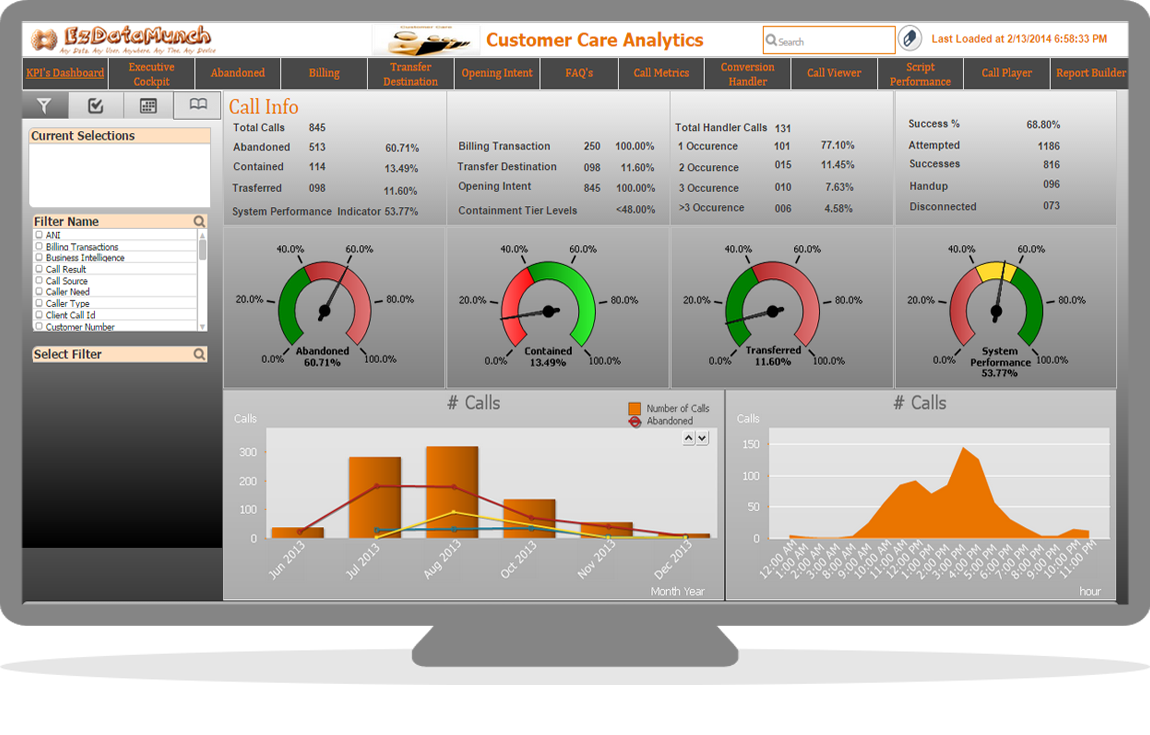
Call Center Dashboards
Analyze customer satisfaction on every call and track customer care executive’s performance.
Business Dashboard Options
Cloud
All the devices having internet connection can access cloud dashboards easily from anywhere with just a click. Dashboards can be developed over the web and can be easily shared across the board.
Mobile
Business dashboards are accessible from any smart phone or tablet. Accessibility can be from the internet or via an application.
On-premise
Selected business dashboard applications are directly installed on networks or computers. Dashboards are managed locally and published through internal tools as reports or any other preferred formats.
Important Elements of Business Dashboards
A business dashboard or a business intelligence dashboard uses various charts and diagrams to represent information collected from multiple data points. Complex data is gathered and transformed into real-time information and portrayed in the simplest and beautiful format for business users to understand and take data driven decisions. Few of the key charts and diagrams are elaborated below.

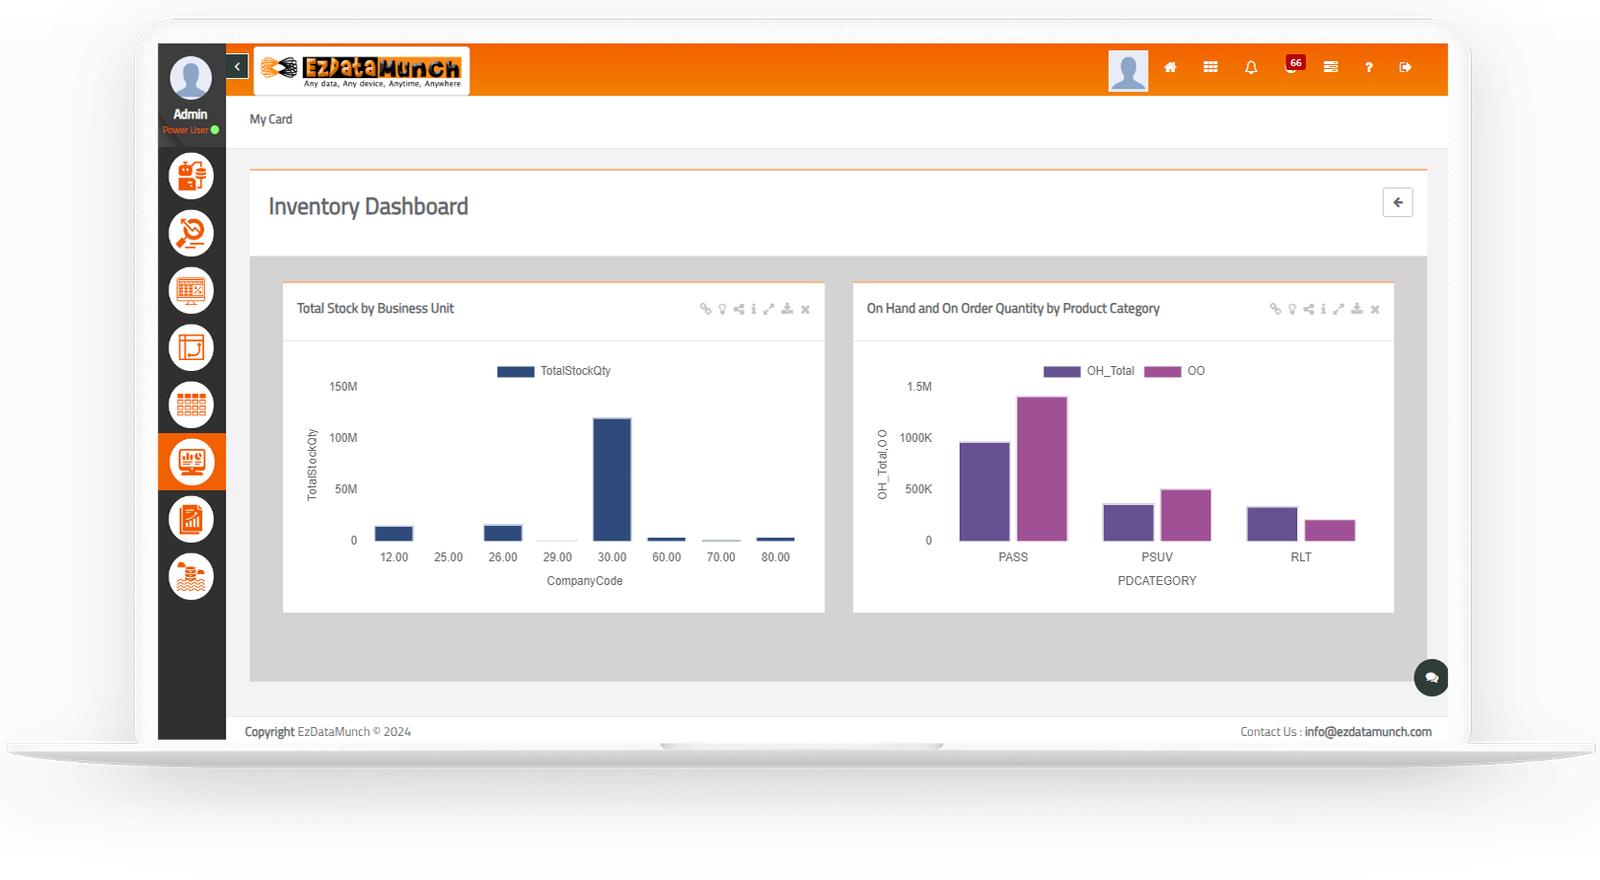
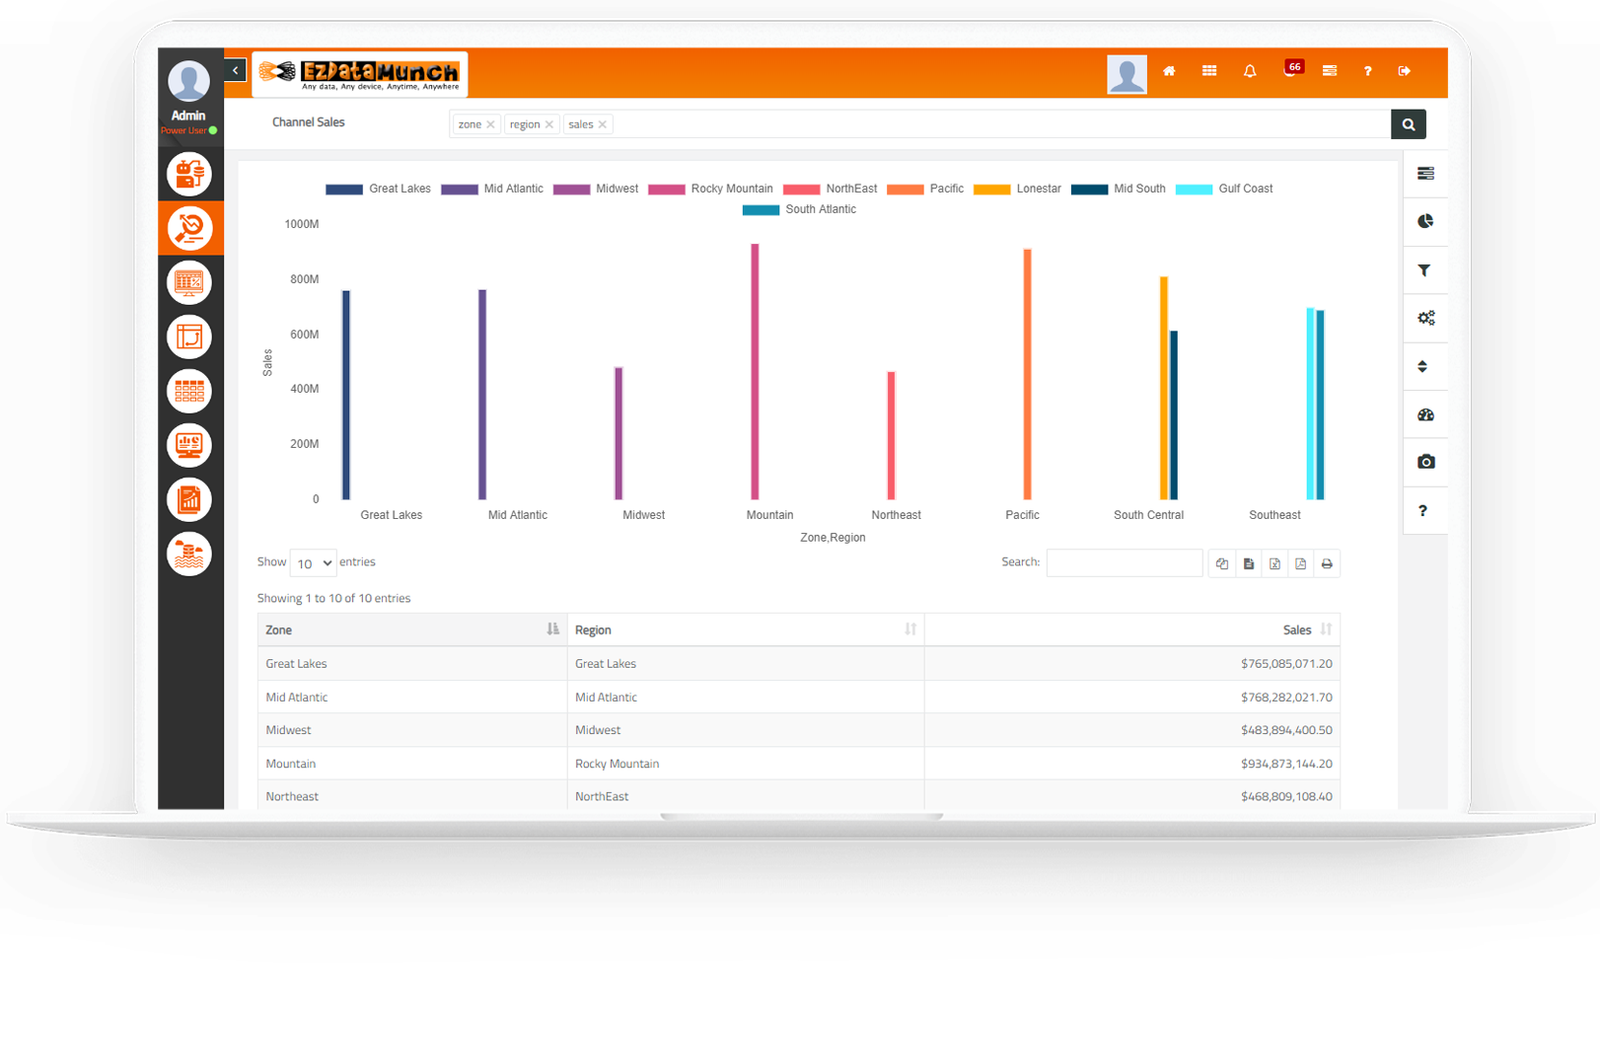
Column Charts
Column charts are used to represent the value of various business elements simultaneously. They are also used as a comparison tool.
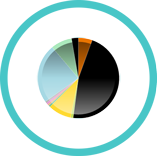
Pie Charts
Pie charts represents relative frequencies and magnitude. Each area in a pie chart is proportional to the quantity it represents.

Bar Diagram
Just like a column chart, a bar diagram is used to compare the values within the same categories.

Gauge
A gauge is often used as a score card that represents progress towards a set of goals.

Line Chart
Line charts are basically used to track trends. They are also used for measuring the change in a value over time

Map Chart
A map chart is used for various purposes. In social media context it can be used to see the market penetration where as in hotels and restaurants, it can represent location performance in various colors.
A quick guide to design an effective business dashboard
A business dashboard or a business intelligence dashboard uses various charts and diagrams to represent information collected from multiple data points. Complex data is gathered and transformed into real-time information and portrayed in the simplest and beautiful format for business users to understand and take data driven decisions. Few of the key charts and diagrams are elaborated below.
Define your users
The most important point to consider before designing a business intelligence dashboard is defining business users. There are multiple departments in an organization and each department has its own hierarchy. A business dashboard needs to be designed keeping in mind the user for example, a dashboard for a “C” level executive should be able to represent the over all health of the organization in a neat and simple way whereas, a dashboard for a manager or an analyst should be more detailed and should comprehensively give information pertaining to their functions. For example, a marketing manager needs real-time information about annual marketing campaigns, effectiveness of those campaigns, ROI from those campaigns and a roadmap for future campaigns.


Selecting The Right Dashboard
There are two main categories of dashboards 1) Analytical / Strategic and 2) Operational. In this stage you need to understand the role of the user and what kind of dashboard will solve their problems. An analytical / strategic dashboard may represents important performance KPIs that are viewed by the board members. These dashboards give a high-level view of companies affairs and may contain information such as yearly revenue, expense, sales pipeline and more. An operational dashboard represents more detailed information regarding a specific operation that may vary as per the industry. For example, a manufacturing operations dashboard gives information such as total input inventory, machine run time, manufacturing scrap, total production, and more.
Choose The Right Metrics
Every business user needs unique set of metrics relevant to their department and designation. Every dashboard represents answers to many questions in the form of important metrics. For a business dashboard to be highly effective, it is important to select the right kind of metrics as per the department and users role. Selecting the right metrics will help you accomplish your goals.

Prototyping And Evaluation
Remember, dashboards are made for immediate actions so its critical to test all the functions of the dashboards and to see if its serving the purpose. Once the dashboards are developed after following all the above steps, its time to put it to use. Get all the required business users on board and ask them to use the newly made dashboards for a day or two. Understand what they have to say after its use and make the necessary changes as per the feedback to make business dashboards more user friendly and department agnostic.
Let’s Get Started
Drive business success by analyzing, exploring, and effortlessly sharing insights with EzDataMunch!
Take your business to new heights with EzDataMunch. Dive into data, explore insights, and share them easily. EzDataMunch makes it easy to grow your business. You don’t have to worry about complicated analysis. Just concentrate on moving your business forward, and EzDataMunch will handle the rest.


