Executive Dashboard

Make better predictions, get detailed geographical scorecards, identify outliers causing profit or loss and take data driven decision.

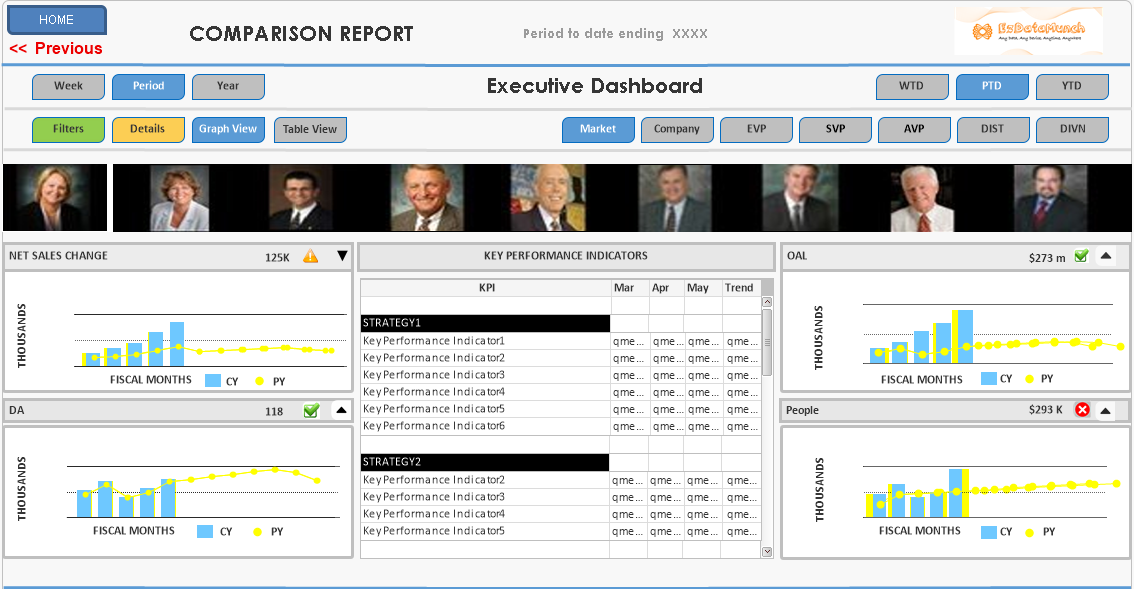
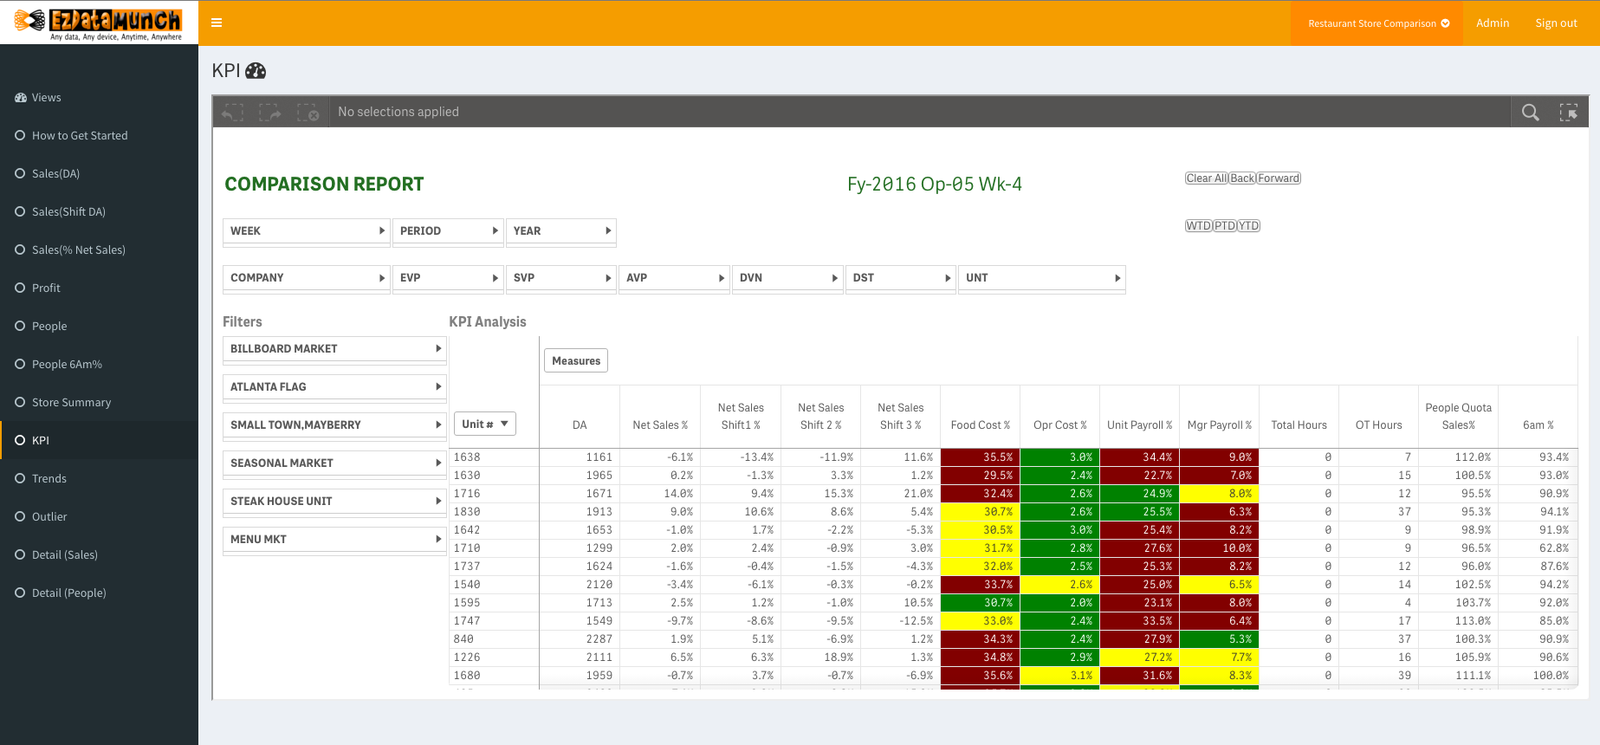
Executives are always pressed for time. They need quick, accurate and real-time reports to get complete insight into profit and loss. Critical components of the report would be location, restaurant operations, expenditure, sales target achieved vs sales target set and staff performance. KPI reports created by gathering information from multiple locations that showcases performance of franchisee or location and to isolate and enhance top factors and take corrective actions for low performers.
EzDataMunch identified the most important metrics for restaurants and turned them into pre-built, any-time and anywhere accessible dashboards that help executives save time, take right decisions and increase profit.

Restaurant KPI Dashboard


  • Get insight into latest trends and compare them with trends from previous week, month or year.
  • Forecast for year ahead based on previous years results.
  • See location wise performance differentiated by market segment in a heat map format. Understand which locations are churning more profits, which locations are progressing towards churning profits and which locations are moving towards loss.
  • Assess factors that are driving markets, risks and challenges involved and check current market ranking.
  • Review key performance indicators like customer value, financial management, operational excellence and talent management.

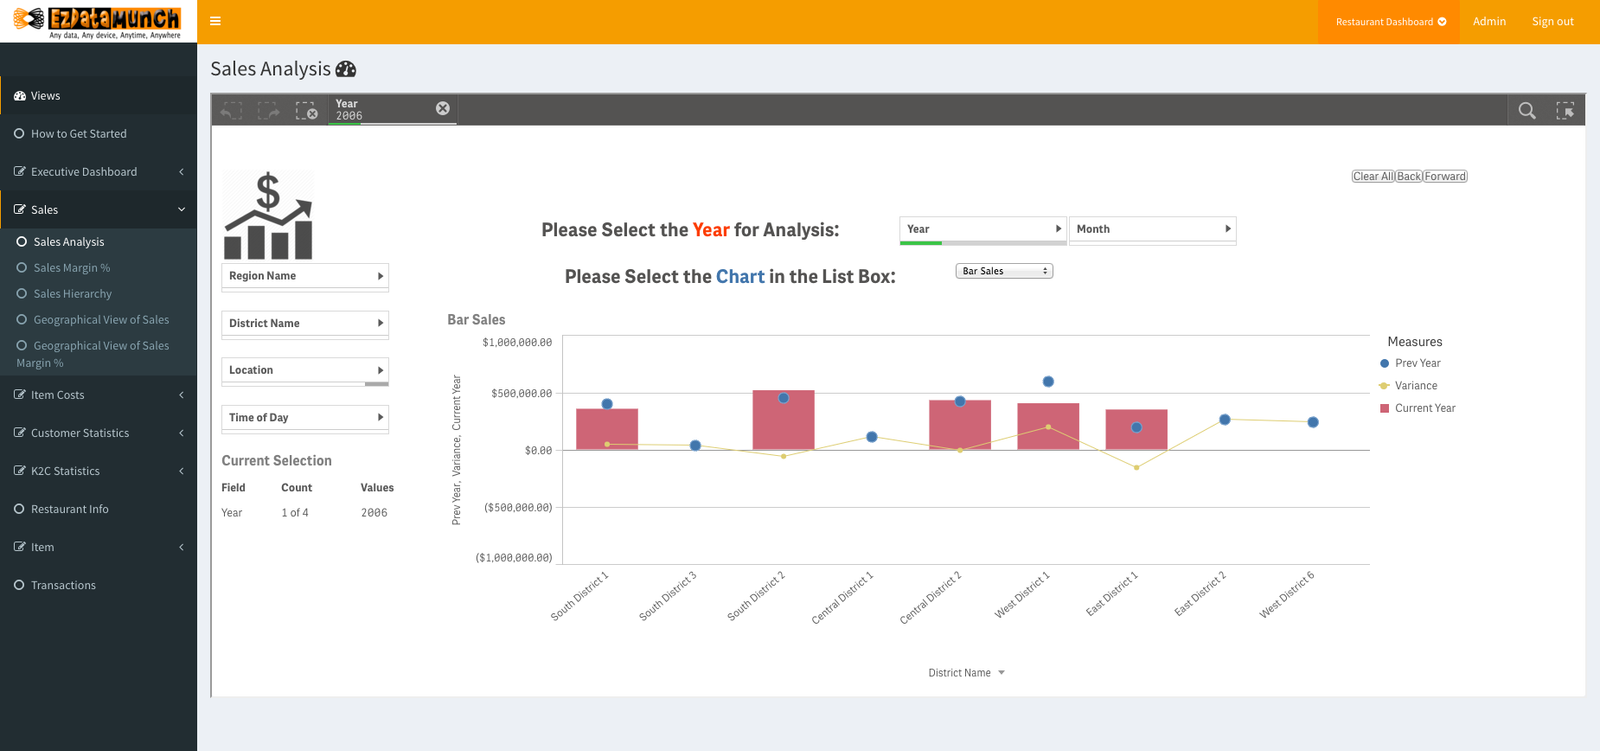
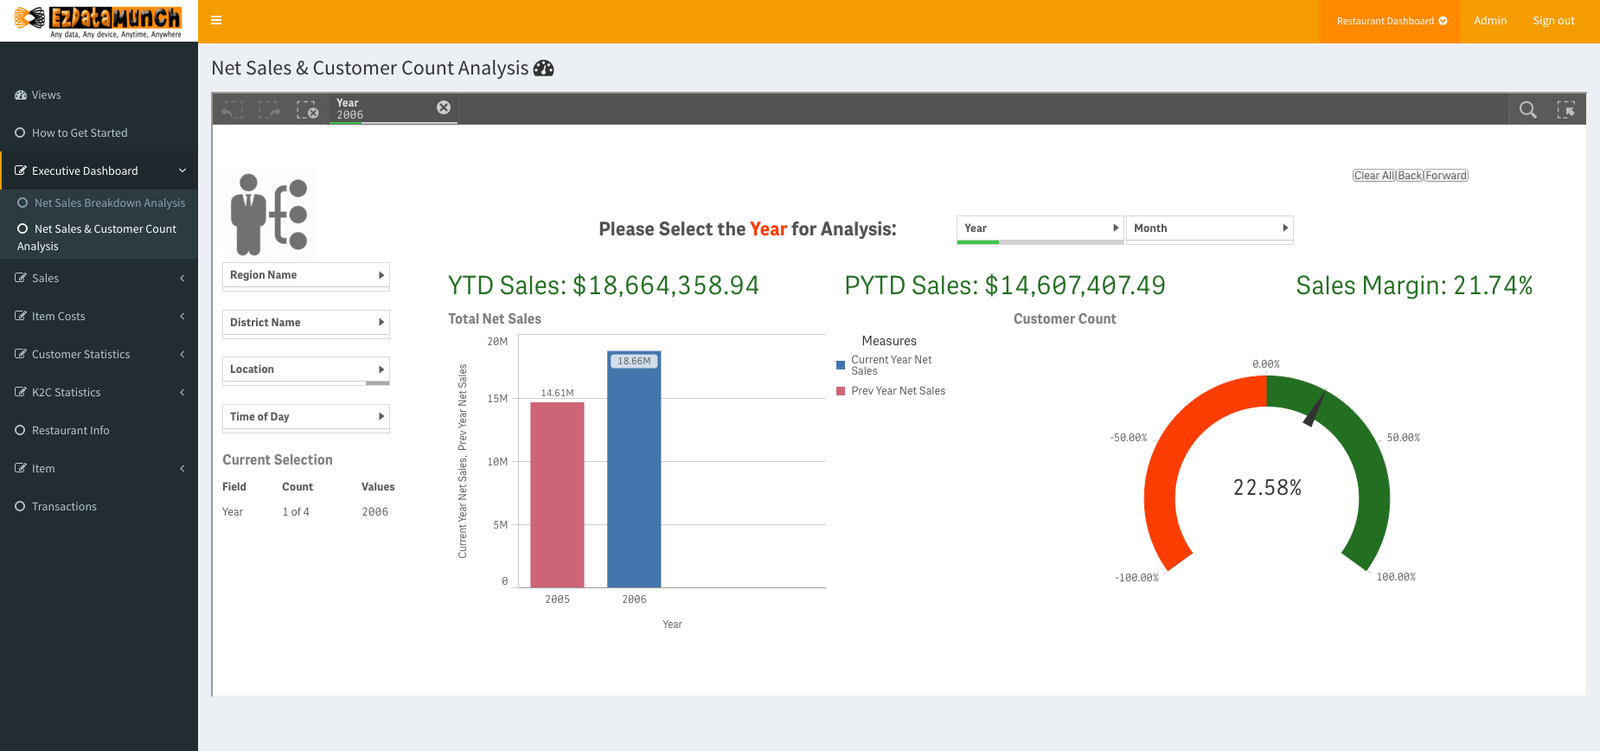
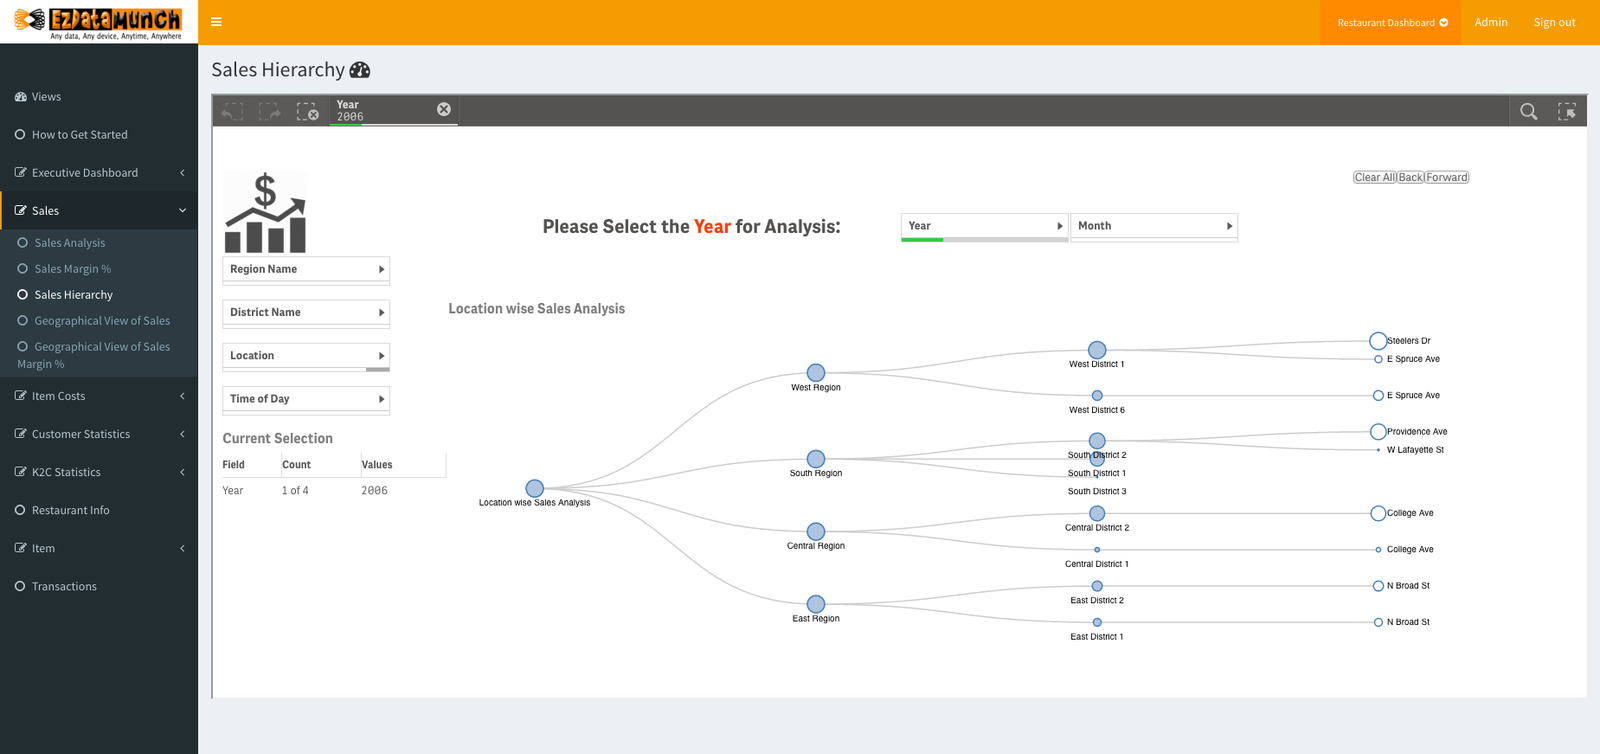
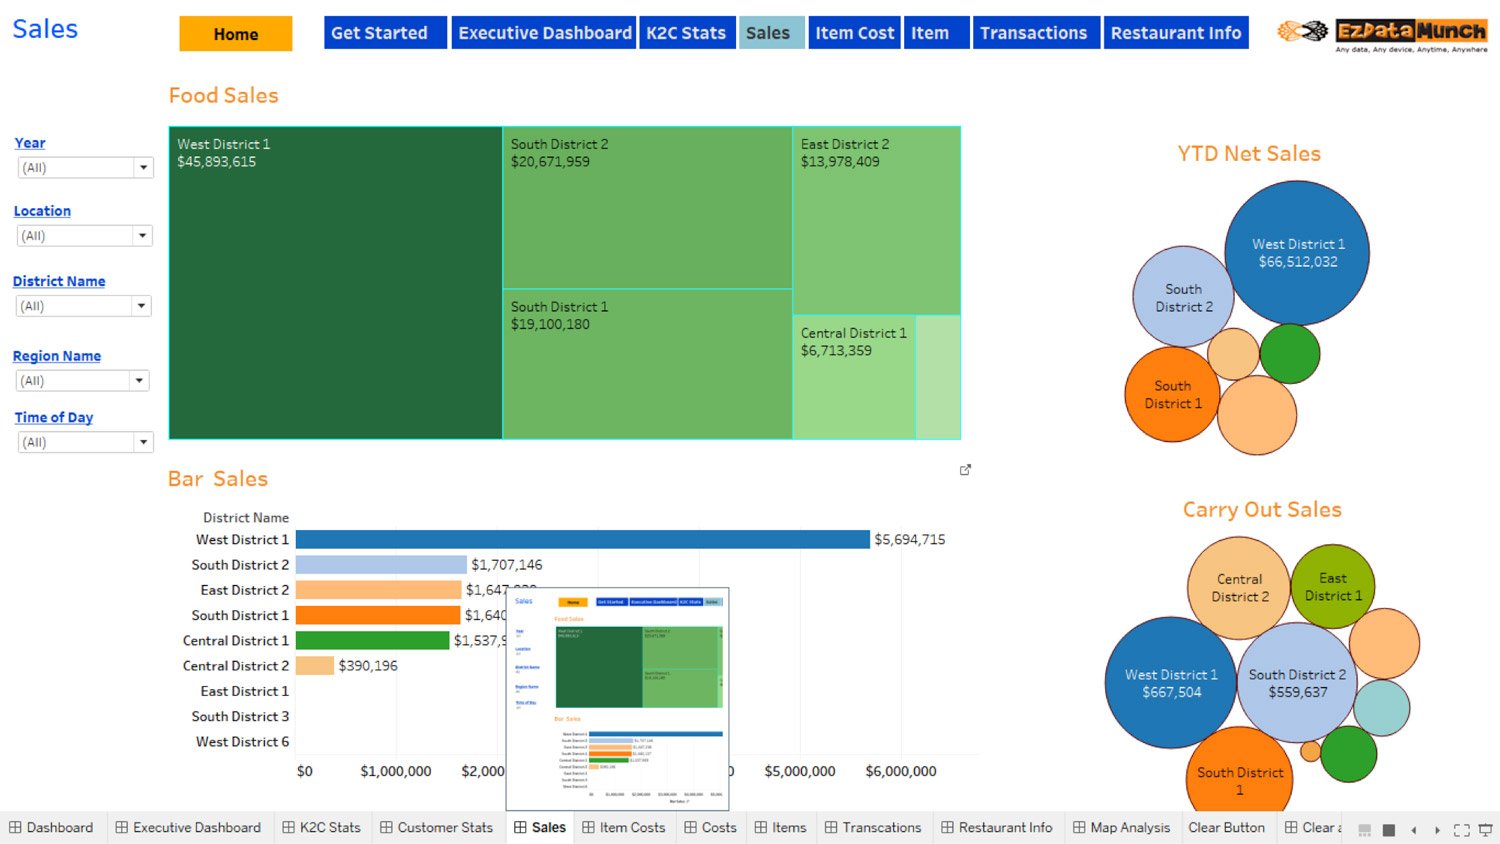
Restaurant Sales Dashboard


  • See net sales stats from all the locations in one dashboard.
  • Compare current net sales with previous years net sales and derive growth rate and targets achieved.
  • Drill down deeper by viewing sales done per shift and per branch or location.
  • Define who can access these reports and make changes based on position and function.

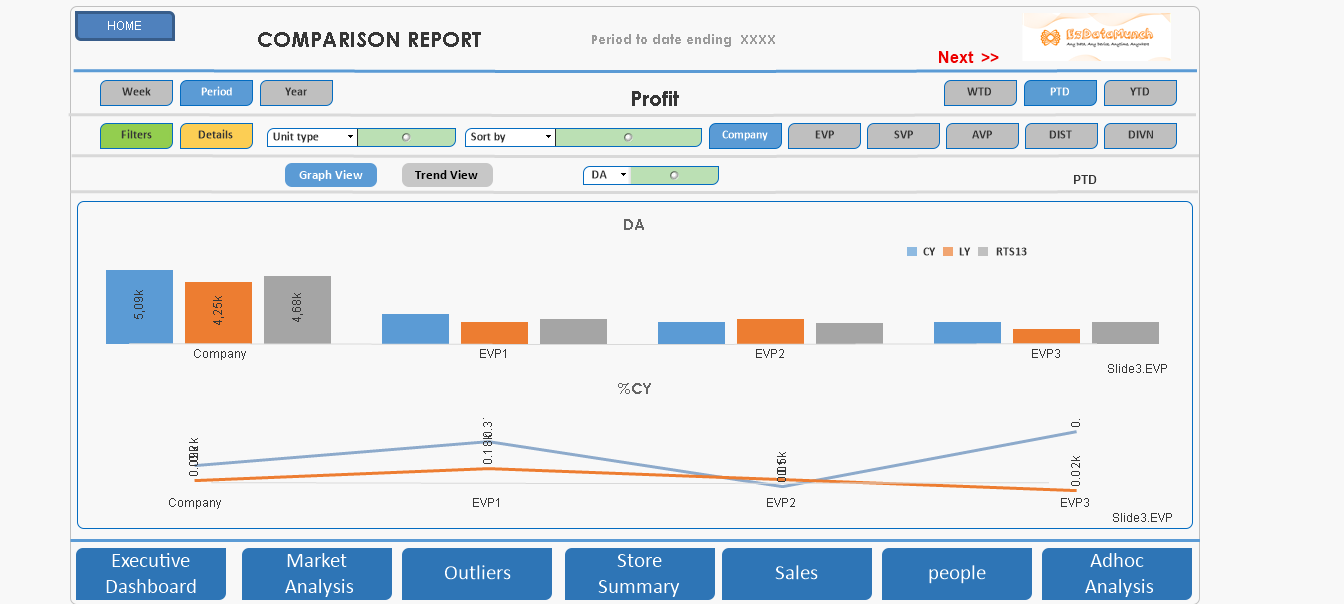
Restaurant Profit Analysis Dashboard


  • See combined profit graph from all the locations or drill down to see profits per location.
  • Compare current years profit with previous years profit and check the target achieved mark.
  • Analyze important elements or trends that have helped to increase profits and enhance them further.
  • Set new profit target based on historical data, operational excellence and cost control measures induced.
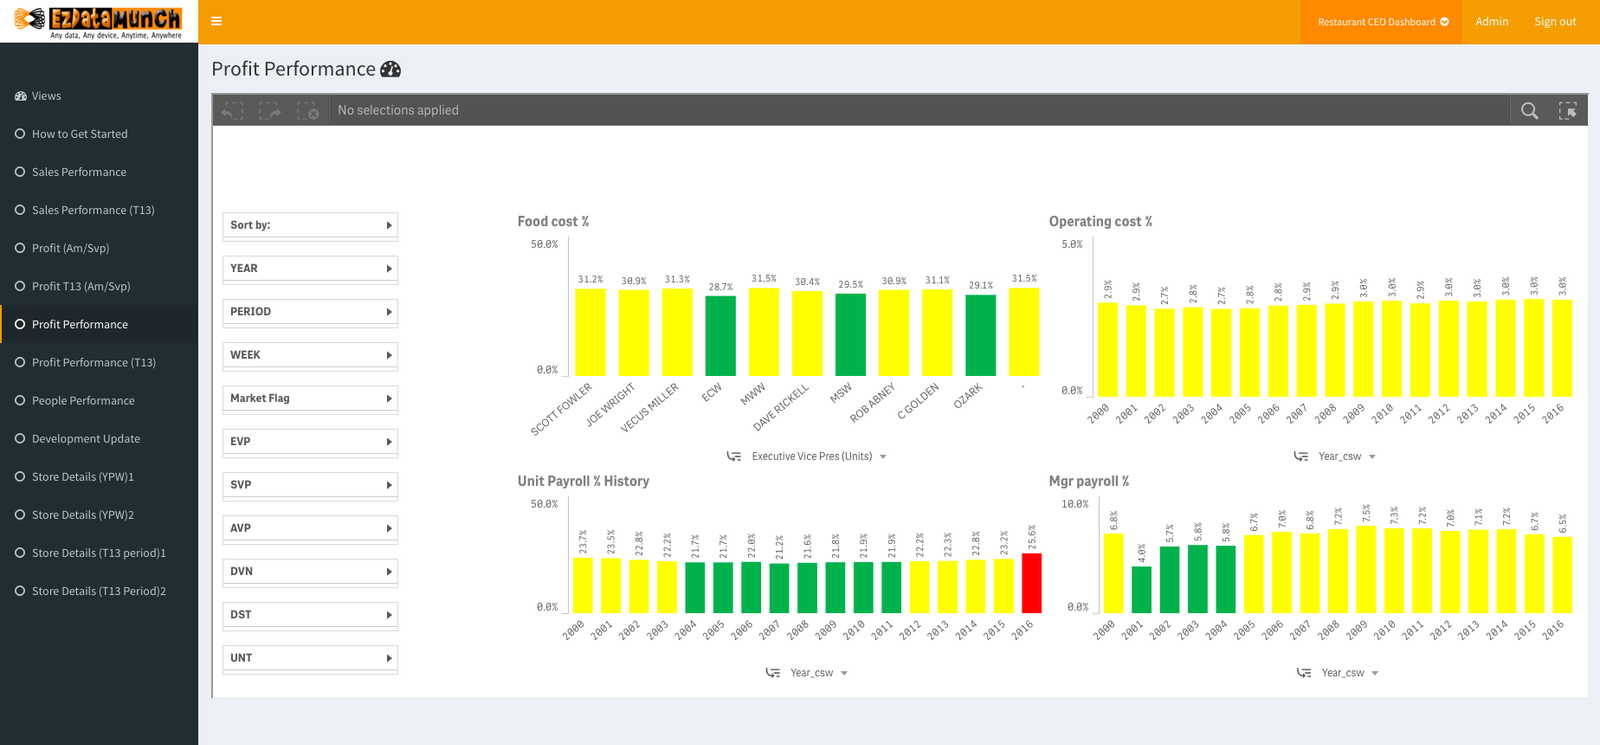
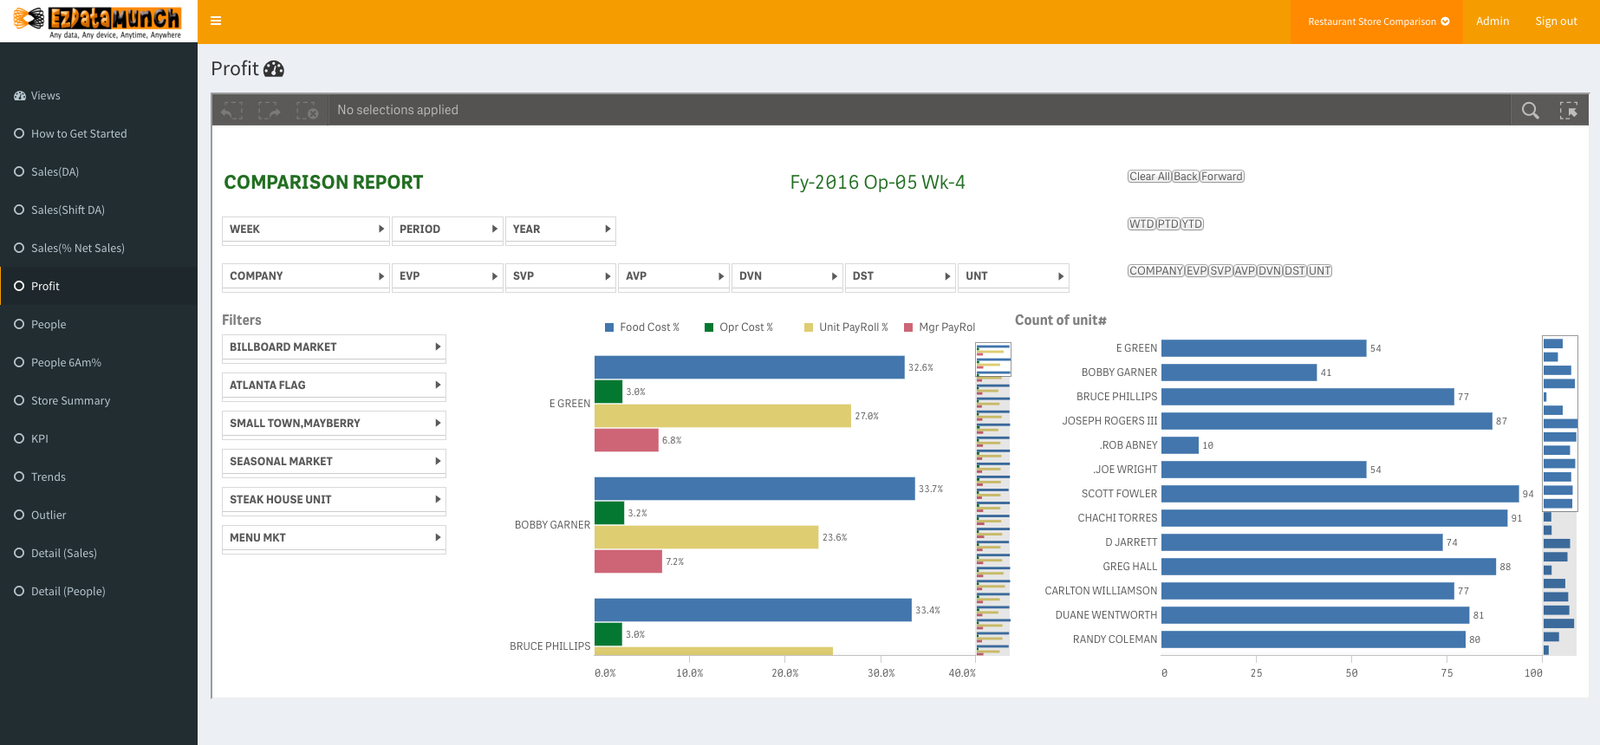
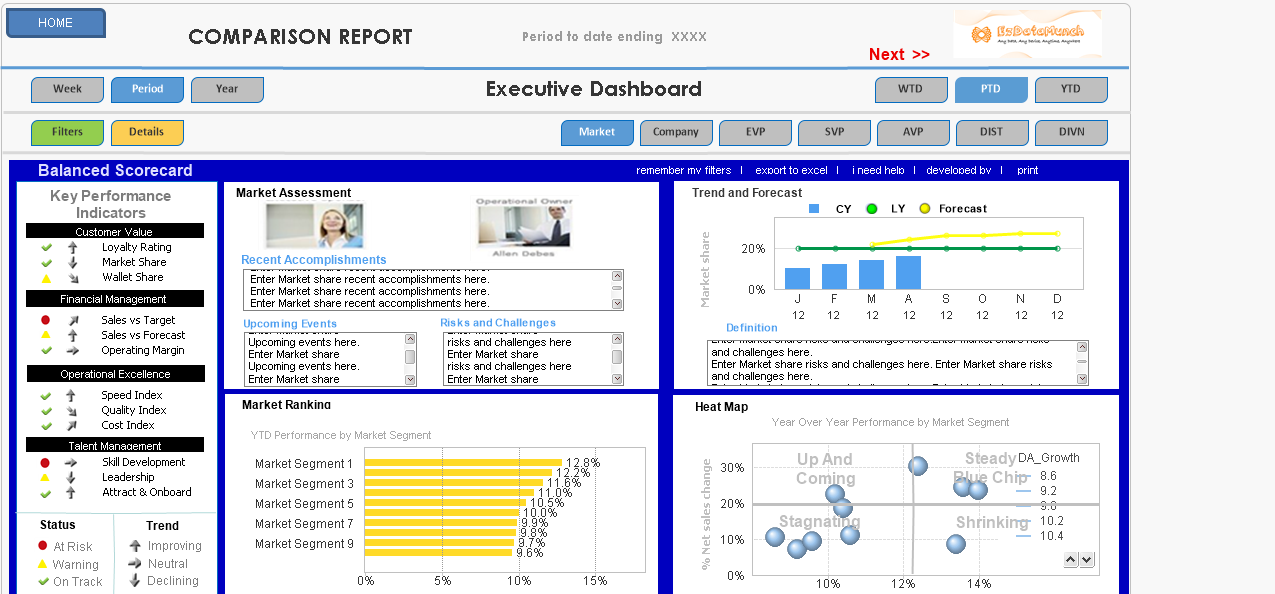
Blogs

The Benefits of Business Intelligence for Small Business Growth

Implementing business intelligence tools can greatly benefit small businesses by providing valuable insights and data-driven decision-making. These tools can help small businesses analyze their operations, identify trends, and make informed decisions to drive growth...

Modern CRM Analytics for your Business – A Guideline to a Sales Manager

One of the biggest benefits of using modern CRM analytics is the ability to gain insight into your customers' behavior and preferences. By analyzing data on customer interactions, purchase history, and demographics, you can identify patterns and trends that can inform...

Effective Techniques for BI Project Execution with Examples and Tools

Business Intelligence (BI) tools are becoming increasingly crucial for businesses to stay competitive in today's market. These tools provide a clear view of all the data a business has, enabling informed and data-driven decision-making. While nearly 50% of businesses...

Effective Tips for Applying Data Analytics to Develop Your Business

Data analytics has become a crucial aspect of business strategy and decision-making in today's world. With the amount of data available at our disposal increasing every day, organizations have realized the importance of analyzing this data to gain insights and drive...

What Are Incremental Sales – Learn Examples and Calculations

Sales are the process of generating leads, converting them into buyers, and then ensuring that they become repeat customers. Selling is not easy. Achieving success with this requires a lot of time, energy, and focus. However, there are some techniques and strategies...

Top 10 Business Intelligence Dashboard Features and Benefits

Business Intelligence Dashboard is a powerful management tool that plays a vital role in decision-making both internally and externally in an organization. Business Intelligence Dashboard is also known as Data Dashboard represents various data visualizations to give...

Financial Reports vs. Management Reports What’s the Difference

Reporting provides a basic understanding of business performance and operations. In a business, a report provides important details regarding future forecasting, marketing planning, budget planning, and decision making. In the article below we will explain Financial...

Dashboard Types – Strategic, Analytical, Operational & Tactical

Business dashboards play an important role in carrying out day-to-day operations. Almost every management level in the organization uses business dashboards to accomplish their task and to take an effective measure for the business. These dashboards have unlimited...

Know Customer Dashboard for Your Customer Insights Analytics

Dashboards have become a business standard tool over the past few decades. Several dashboards have participated to meet the demand to meet business requirements and achieve business goals. Just like the sales dashboard helps the business to see the total sales, the...

QlikView Vs Qlik Sense Comparison – Which is Better BI Tool

The demand for business intelligence tools has increased over the past few decades. BI tools are becoming a new source of providing efficient data storage and transportation. Well, many companies have already experienced Qlik and realized the power of Business...

Events

Up Coming Webinar

Completed Webinars

Our Hospitality Client’s Experience.


Hospitality

We were looking for a smarter financial analysis solution. We provided few data samples and within 6 days we could see a very exhaustive dashboard with our KPIs well laid down using EzDataMunch Finance Dashboard Playbook for hotel chains.

Assistant Controller

Share This