
Tracking and analyzing sales performance is essential for businesses to make informed decisions and optimize their sales strategies. Depending on the reporting frequency, sales teams and managers can gain insights into trends, challenges, and opportunities. Below are examples of daily, weekly, and monthly sales performance reports to help businesses stay on top of their sales goals.
What Is a Sales Report?
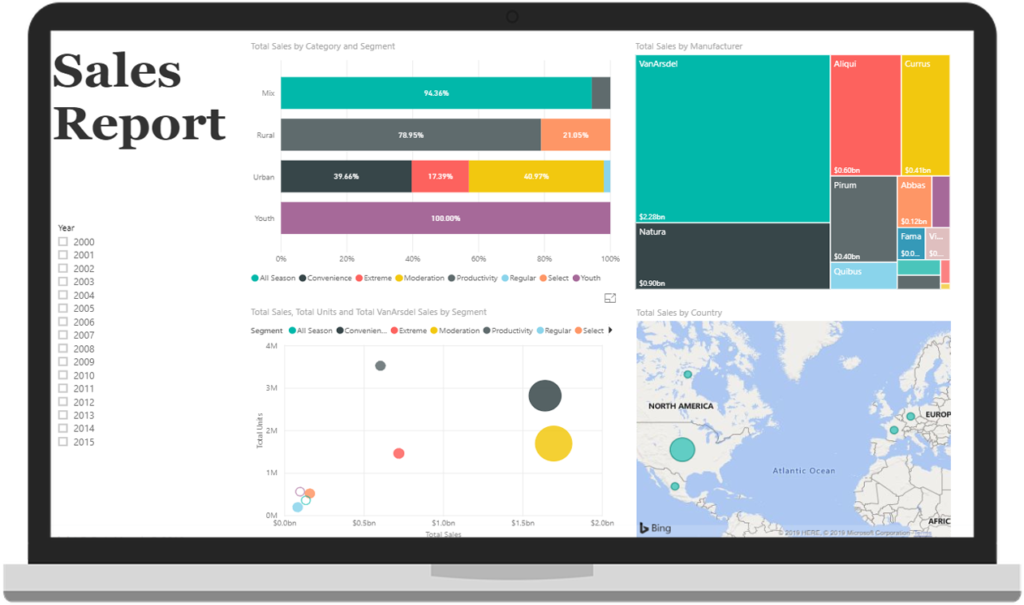
Sales Report or Sales Analysis Report shows overall trends in the number of sales of the company over time. Perhaps most sales reports show that sales are increasing or decreasing. The sales report describes the records of all calls sold by a seller or management during a particular time frame, supporting effective management reporting.
It gives a good picture of the company’s activities for a specific and situation and provides reliable solutions to handle the operation. It also provides new opportunities and market trends that’s improve the result.
Sales reports can be of various forms
Daily Basis
Daily sales report allows you to track the daily activities that happen in the organization such as calls or follow up, number of leads generated, Daily production report, etc.
Weekly Basis
Weekly sales reports allow us to manage the number of deals closed by the sales team, amount of revenue collected, etc.
Monthly Basis
Monthly basis report works in detail picture. It provides individual activity of a sales team and the amount of revenue collected by individual sales team.
Data to be analyse for sales report
- Sales volume that is observed per item or according to group of items
- The number of current and new accounts that were contacted and when
- Any costs that were incurred in promoting and selling the products
Why Sales Report is important?
Sales reports are a primary tool for any business sales manager to track the efforts you make to create sales revenue, opportunity status, business, health and sales reports.
The other benefit of the sales report is from the sales representative’s perspective that they can summarize how many deals they have on each of the sales processes.
Let’s quickly consider an example, if some recent activity is going to any sales representative with the client and during the next visit, they have all the necessary information available at the click of a button.
Monitoring team performance sales report
All sales representatives engage with customers in real time through calls, emails, face-to-face visits, etc. Do you think this is a simple job, but thanks to the sales report tool, which makes their work easy.
With this sales report, sales reps can easily track weekly meetings, pending meetings, follow-up plans, next schedule plans etc.
We also run through:
- New opportunities generated.
- Number of first-time visits made.
- The nature of conversations had with prospects.
Types of Sales Reports
Below we have discussed type of sales report which works independently on reporting rules.
Daily call report
Daily call report provides a daily work report of sales representatives. Number of calls made per day, Number of customers engaged, deal close status, pending status and conversion between customers. This all keeps in records within a single click.
Productivity report
The Productivity Report monitors all activities occurring within the sales organization and indicates whether each sales representative is more than underperforming and / or meeting expectations.
Lead sales report
The lead sales report gives the status of the individual sales representatives. Statistics can be tracked on the number of sales per month, number of deals closed by individuals, and their performance. It also shows the trend of sales over time.
Promotional sales report
Promotional sales report measure sales and sales results by store, which helps the user to discover the effectiveness of the promotion.
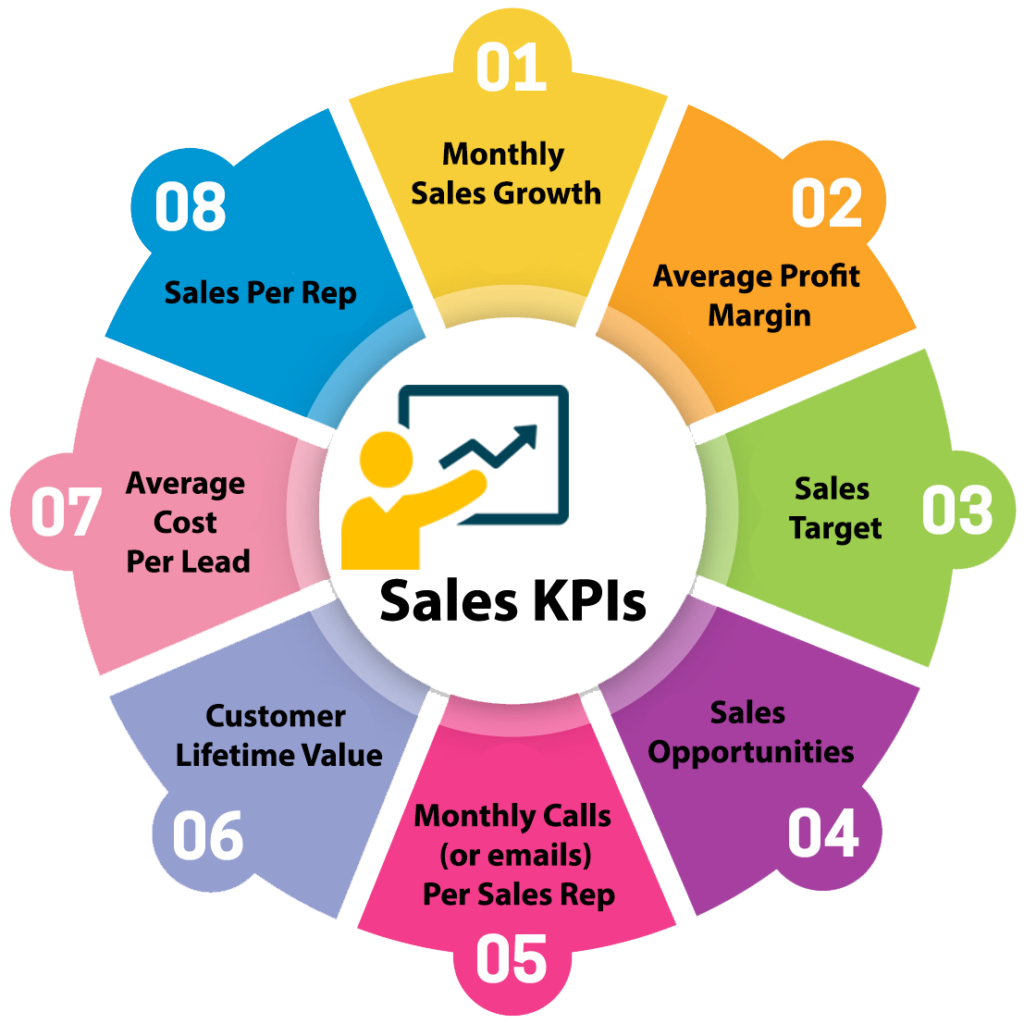
Sales performance KPIs
Here we present the top selling KPIs used by the modern sales team. The effectiveness and selection of each KPIs should always depend on the business and marketing / sales model.
How to write a monthly sales report
The sales report plays an important role in increasing sales percentage and performs better for sales representatives. But this is only helpful that we deploy the sales report in the appropriate cause. Below are five steps to creating a sales report, which will help you break the sales reporting process.
Step1- Target your reporting audience
Identifying the right audience for this Sales Report enhances its impact. Sales Managers use it to evaluate individual sales representatives, optimize strategies, and improve team performance. Senior Managers focus on key metrics like total sales, leads generated, and overall productivity to assess the team’s effectiveness and align business goals.
Self-reporting also plays a crucial role, allowing sales professionals to track daily progress, refine their strategies, and take necessary actions to achieve sales targets.
Step2- Gather Sales Metrics
The next step after reaching your reporting audience is to measure sales metrics in a qualitative or quantitative way. Monitoring sales reporting can help someone to answer the question easily like:
- How much time will it take to close the deal?
- What is the possibility of getting a deal close?
- What is the factor to get convince to client?
- Which area maximum sales are generated?
- How do we get clients out of the pipeline?
- Which salesperson doing best?
Step3- Reporting Time Frame
Setting a time limit helps in selecting the most relevant information for reporting, making it easier to compare progress over time. Each report should align with its objective to ensure efficiency and effectiveness.
For instance, if someone spends excessive time collecting resources instead of focusing on key tasks, it can slow down the entire team and reduce overall progress. Therefore, maintaining a strict time frame improves productivity and goal achievement.
Step4- Graphical Presentation
Graphical presentation is better approach while using textual content. Chart such as bar chart, pie chart can simplify dense information and show change over time immediately.
Now a days no one bother to read a huge line of text. Everyone moving to simplify version. And graphical presentation correct guideline as come with the text format.
Step5- Add Context to Your Data
It is necessary to present your data in a spreadsheet but adding it in the context of your number will attract someone’s attention.
Suppose statistic of lead is not up to the mark and its moving down from the months before, it’s important to use the opportunity to discuss the quality of the leads coming in, or reasons why the leads coming in aren’t closing.
Sales performance dashboard examples
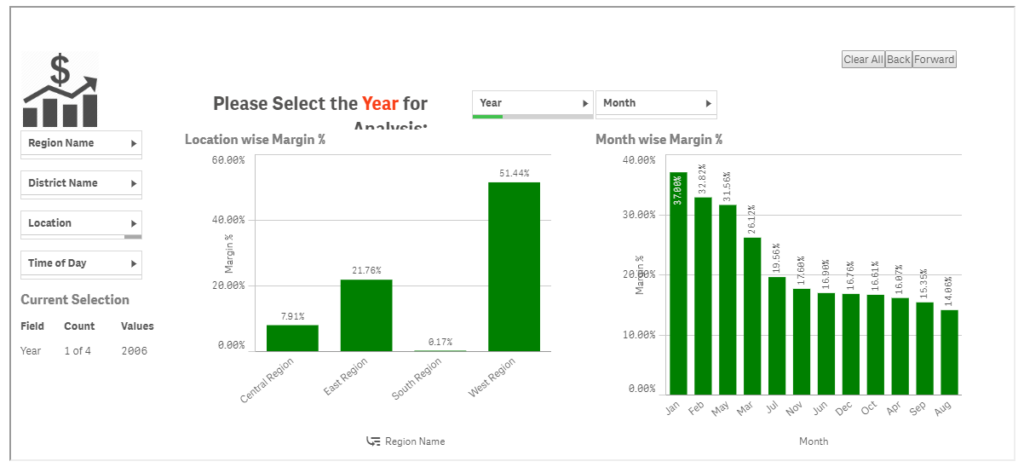
Sales Margin
Sales margin is the percentage of profit from sales after deducting costs. It helps businesses measure profitability, set pricing strategies, and optimize overall financial performance.
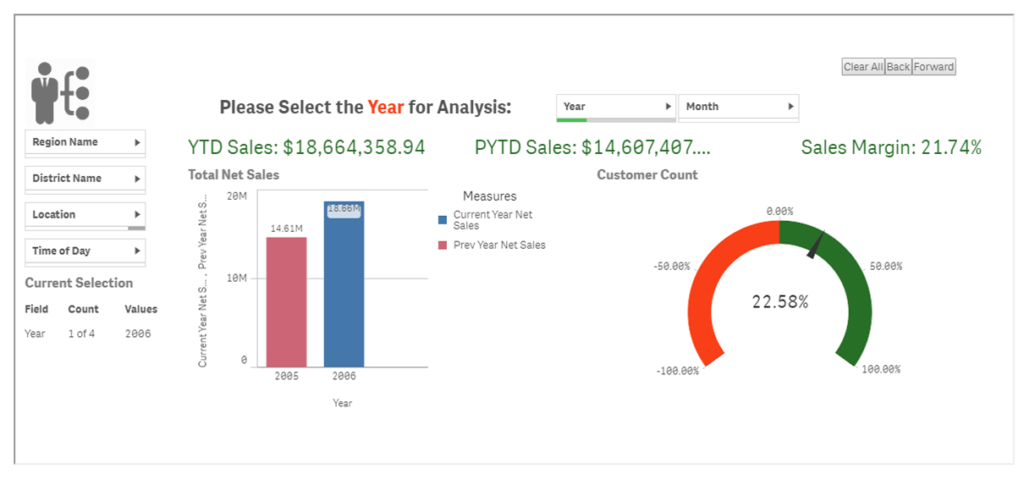
Net sales customer count
Net sales customer count refers to the total number of unique customers contributing to net sales after returns, discounts, and allowances within a specific period.
Revenue Analysis
Revenue analysis involves evaluating a company’s income, identifying trends, understanding key drivers, and assessing performance to make informed business decisions and optimize profitability.

Conclusion
Sales performance reports, whether daily, weekly, or monthly—are essential for monitoring business growth and making data-driven decisions. Daily reports help with quick adjustments, weekly reports provide short-term trend analysis, and monthly reports offer a comprehensive view of sales performance. By leveraging these reports, businesses can optimize their sales strategies, enhance team performance, and boost overall revenue.
Register for an EzDataMunch Free Trial today to access automated sales performance reports and gain actionable insights!
FAQ’s
What is a daily sales performance report?
A daily sales performance report tracks sales activities, achievements, and challenges, helping managers evaluate team productivity and adjust strategies.
Why is a weekly sales performance report important?
Weekly reports highlight trends, measure progress, and identify areas for improvement, ensuring timely adjustments to sales tactics and goals.
What should a monthly sales performance report include?
Monthly reports summarize key metrics, compare performance against targets, and identify long-term trends, supporting strategic decision-making and forecasting.
How can sales performance reports drive improvements?
Sales performance reports provide insights into strengths and weaknesses, helping teams identify improvement areas and implement more effective sales strategies.

Abhishek Sharma
Website Developer and SEO Specialist
Abhishek Sharma is a skilled Website Developer, UI Developer, and SEO Specialist, proficient in managing, designing, and developing websites. He excels in creating visually appealing, user-friendly interfaces while optimizing websites for superior search engine performance and online visibility.