
Every business today has access to more data than ever before. But having data is not the same as understanding it. Before you can build data dashboards, run analytical models, or make informed business decisions, you need to explore your data and prepare it properly. This is where data exploration and data preparation play a critical role.
Let us break this down step by step.
What Is Data Exploration (EDA)?
Data exploration, often called Exploratory Data Analysis (EDA), is the first hands-on interaction with your data. The goal is simple: understand what you are working with.
At this stage, analysts try to answer basic but important questions:
- What does the data look like?
- How much data do we have?
- Are there missing or incorrect values?
- How are different variables related?
- Do any patterns or anomalies stand out?
EDA helps you build intuition about the data before jumping into conclusions or advanced analysis. It reveals the structure of the dataset, how values are distributed, and how different fields interact with each other.
In practice, this work is done using a mix of visual tools and lightweight statistics. Charts, tables, summary metrics, and quick plots often tell you more than complex formulas at this stage. Tools like Excel, Power BI, Tableau, Python, or R are commonly used, depending on the team and use case.
For business users, data exploration helps answer “What is really happening?”
For technical teams, it helps answer “Can this data support the question we want to ask?”
Why Data Exploration Matters
Data exploration helps avoid costly mistakes later. Without it, teams may create reports, dashboards, or models using incomplete or misunderstood data in any type of data analytics.
EDA helps:
- Detect data quality issues early
- Identify trends and relationships worth investigating
- Avoid wrong assumptions
- Save time during modeling and reporting
In short, better understanding upfront leads to better decisions downstream.
What Is Data Preparation?
Once you understand the data, the next step is to make it usable. This is data preparation.
Data preparation focuses on collecting, cleaning, combining, and structuring data so it is ready for analysis or reporting. Raw data is rarely analysis-ready. It often comes from multiple systems, in different formats, with missing or inconsistent values.
Think of data preparation as turning raw ingredients into something you can cook with.
Why Data Preparation Is Necessary
Data preparation is not optional. It is required if you want reliable insights.
It helps when:
- Data is unstructured or inconsistent
- Information comes from multiple sources
- Reports need to be generated quickly
- Data is extracted from files like PDFs or scraped documents
Clean and well-prepared data improves accuracy, speeds up analysis, and builds trust in the results.
Common Data Preparation Steps
While the details vary by organization, most data preparation processes follow a similar flow.
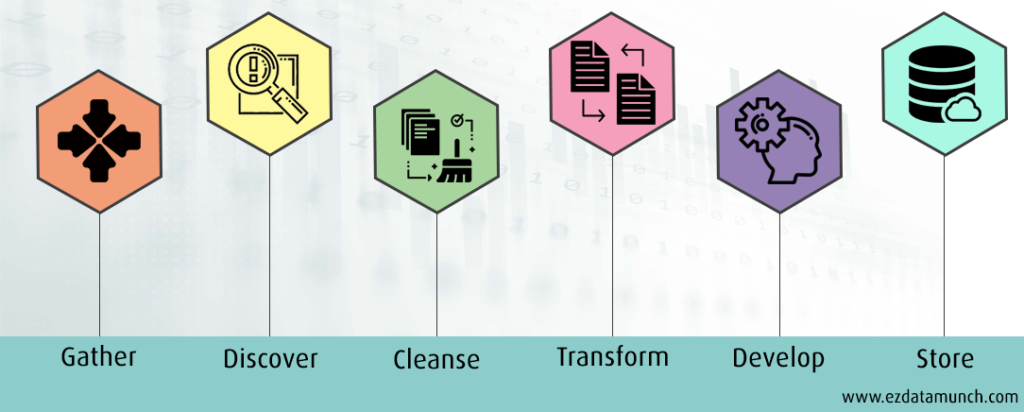
- Collect the Data
This starts with gathering data from all relevant sources. These could be databases, spreadsheets, APIs, logs, or third-party tools. At this stage, the focus is on completeness, not perfection.
- Understand and Organize the Data
Next, analysts explore what each dataset contains. They identify what each column represents and group related data together. This step can take time, especially when dealing with large or unfamiliar datasets, but it sets the foundation for everything that follows.
- Clean and Validate
This is where most effort goes. The goal is to remove or fix data that could distort results. Typical tasks include:
- Removing duplicates and irrelevant records
- Handling missing values
- Fixing formatting issues
- Identifying and treating outliers
- Protecting sensitive information
Once cleaned, the data is usually reviewed or tested to ensure nothing critical was lost or altered incorrectly.
- Transform the Data
Transformation ensures the data is consistent and easy to work with. This may include standardizing formats, converting values, or aligning categories so outputs are clear and reliable for Business Intelligence systems, dashboards, and reports, serving both technical teams and business users effectively.
- Store and Share
After preparation, the data is stored in systems where it can be used by analytics and BI tools. At this point, the data is ready for reporting, modeling, or further analysis.
Benefits of Good Data Preparation
Well-prepared data delivers clear advantages:
Errors are identified early:
Data issues are detected before analysis begins, reducing rework, delays, and incorrect conclusions later in the process.
Analysis becomes faster and more reliable:
Clean, structured data reduces manual fixes and ensures consistent results across dashboards, models, and analytical workflows.
Reports are easier to interpret:
Well prepared data improves clarity, making insights easy to understand for technical teams and business leaders, and supporting a strong Business Intelligence strategy.
Business decisions are based on trustworthy information:
Accurate and validated data builds confidence, allowing leaders to make decisions without second-guessing data quality.
Simply put, better input leads to better output.
The Role of Data Exploration in Analysis
During data exploration, analysts assess:
- The number of records
- Available variables
- Missing values
- Possible relationships between fields
Once these relationships are understood, teams can move forward with confidence to build models, dashboards, or forecasts. This stage also helps define hypotheses and refine business questions before deeper analysis begins.
Data Exploration Methods
Data exploration can be done in two main ways.
Automated exploration uses visualization and BI tools to quickly surface trends and patterns. This approach is popular because it is fast and accessible to non-technical users.
Manual exploration involves filtering data, writing scripts, or inspecting datasets directly in tools like Excel or Python. This approach offers more control and is often used by analysts and data scientists.
Most teams use a mix of both.
Common Data Exploration Techniques
Depending on the problem, different techniques are used:
- Univariate analysis looks at one variable at a time to understand its distribution.
- Bivariate analysis examines relationships between two variables, such as correlation or trends.
- Multivariate analysis explores interactions among multiple variables.
- Principal component analysis (PCA) reduces complexity by summarizing correlated variables into fewer components.
These techniques help narrow focus and guide the next steps.
Tools Used for Data Exploration
Many BI and visualization tools support data exploration. Popular choices include Microsoft Power BI, Tableau, and Qlik. These tools allow users to explore data visually and share insights easily with business stakeholders.
Data Exploration and Preparation steps
The quality of any analytical or predictive output depends on the quality of the data used as input. When data is well structured, consistent, and meaningful, results remain reliable for predictive models and analytical reporting. This is why careful data understanding and preparation are essential before any analysis begins.
Below are the key steps commonly followed to understand, clean, and prepare data effectively:
- Variable Identification
- Univariate Analysis
- Bivariate Analysis
- Treatment of Missing Values
- Treatment of Outliers
- Variable Transformation
- Variable Creation
Let us walk through each step, starting with variable identification.
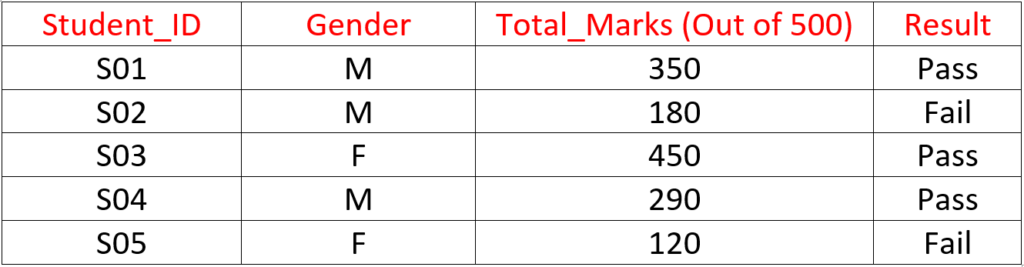
Variable Identification
This is the foundation of the entire analysis process. At this stage, the goal is to clearly define what you are trying to predict and which inputs will help you make that prediction.
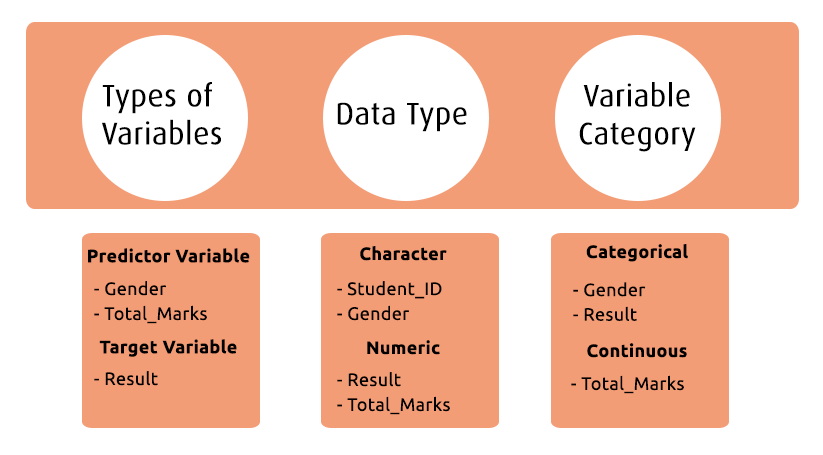
First, identify:
- Target variable – the outcome you want to predict
- Predictor variables – the inputs that influence the outcome
Next, determine the data type (numeric, categorical, boolean, etc.) and variable category (continuous, discrete, ordinal, nominal) for each field. This classification directly impacts how the data will be analyzed and transformed later.
Univariate Analysis
Univariate analysis focuses on examining one variable at a time. The purpose is to understand its distribution, range, and overall behavior before looking at relationships with other variables. This step helps identify data quality issues and sets a baseline for deeper analysis.
The approach depends on the type of variable being analyzed.
Categorical Variables: Categorical variables represent distinct groups or labels. These values are limited and usually describe a category rather than a number.
Examples include pass/fail status, gender, product type, or customer segment.
These variables are typically analyzed using:
- Count to see how many records fall into each category
- Percentage to understand the relative distribution
Bar charts are commonly used to visualize categorical data, making it easy to spot imbalance or dominance across categories.
Continuous Variables: Continuous variables are numerical and can take a wide range of values, including decimals. They represent measurable quantities such as height, weight, time, scores, or revenue.
When analyzing continuous variables, analysts look at:
- Distribution and spread
- Minimum and maximum values
- Average, median, and variability
Visualizations like histograms, line charts, or box plots are often used to understand patterns, skewness, and potential outliers.
Bivariate Analysis
Bivariate analysis examines the relationship between two variables at the same time. The goal is to understand whether changes in one variable are associated with changes in another.
In most cases, one variable is treated as an input (X) and the other as an output or response (Y). This type of analysis helps answer questions like: Do these variables move together? or does one influence the other?
Bivariate analysis is especially useful for identifying patterns, trends, and dependencies before building predictive models.
Common Bivariate Analysis Techniques
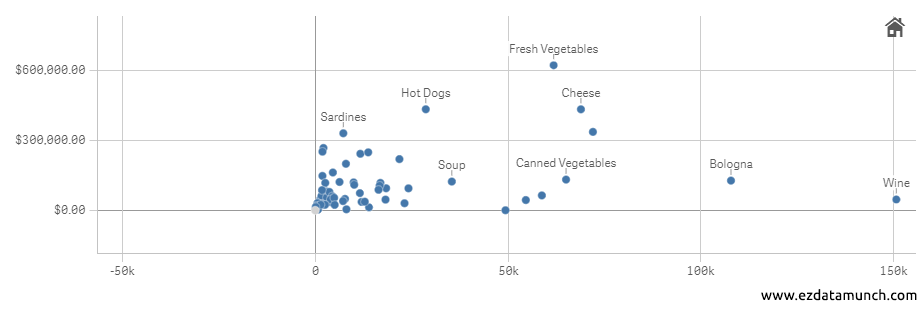
- Scatter Plots
Used to visually explore the relationship between two numerical variables. Patterns in the plot can indicate trends, clusters, or outliers. - Regression Analysis
Helps quantify the relationship between variables by estimating how changes in one variable affect another. - Correlation Coefficients
Measure the strength and direction of the relationship between two variables, indicating whether they move together or independently.
Missing Values Treatment
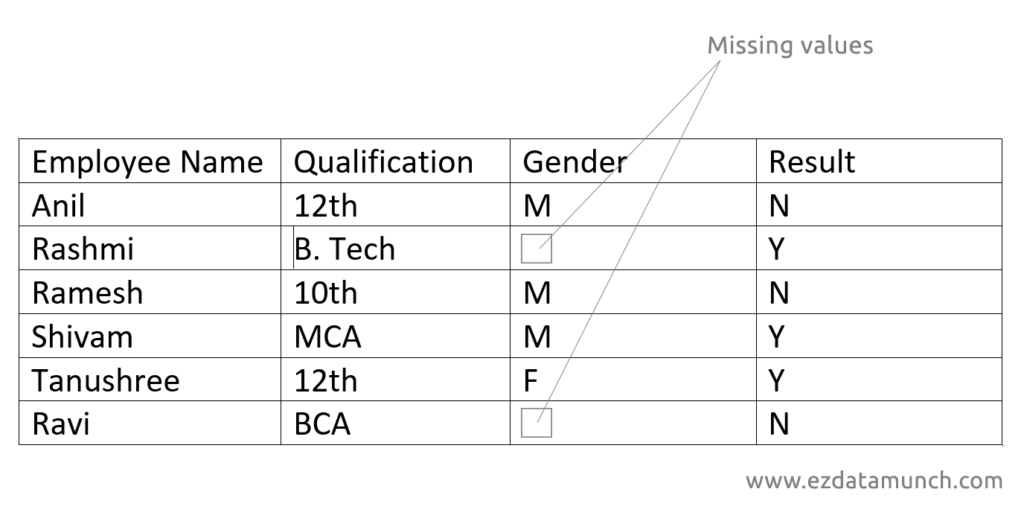
Handling missing values is a critical step in data preparation. If missing data is ignored or treated incorrectly, it can distort analysis and lead to misleading results.
Missing values can occur for many reasons, such as data entry errors, system failures, or incomplete data collection. Regardless of the cause, they must be addressed before building models or generating insights.
If left untreated, missing values can:
- Skew statistical calculations
- Reduce model accuracy
- Lead to incorrect predictions or classifications
Common approaches include removing records with excessive missing data or filling missing values using appropriate methods based on the data type and business context. The key is to choose a method that preserves the integrity and meaning of the data.
Proper treatment of missing values ensures more reliable analysis and trustworthy outcomes.
Outlier Treatment
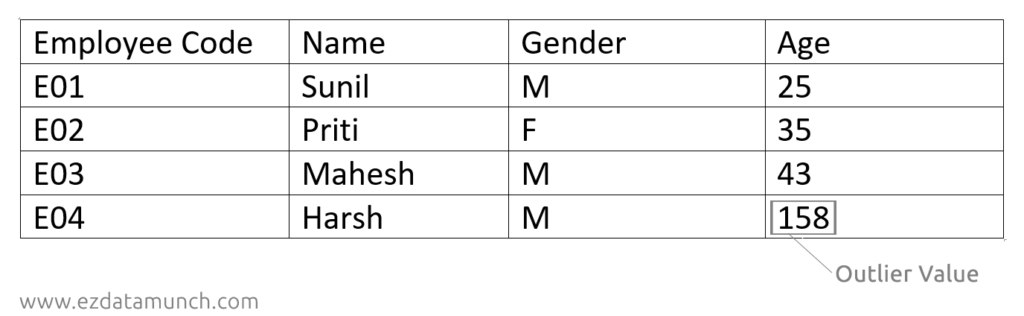
An outlier is a data point that significantly differs from the rest of the dataset. These values often appear unusually high or low compared to typical observations.
Outliers can occur due to data entry mistakes, measurement errors, or genuine but rare events. If not handled carefully, they can heavily influence averages, trends, and model performance.
Outliers are commonly identified through:
- Visual inspection of data tables or worksheets
- Charts such as box plots and scatter plots
- Simple statistical checks
Once identified, outliers should be reviewed rather than removed blindly. Depending on the context, they may be corrected, capped, or excluded to ensure the analysis reflects realistic and meaningful patterns.
Variable Transformation
Data rarely arrives in a format that is immediately ready for analysis. Variable transformation involves modifying existing data values to make them more suitable for analysis or modeling.
This process applies mathematical or logical operations to each data point to improve consistency, scale, or interpretability. Common reasons for transformation include handling skewed distributions, aligning units, or meeting model assumptions.
Examples include normalizing values, applying logarithmic transformations, or converting categorical values into numeric formats.
Proper variable transformation improves model performance, makes patterns easier to detect, and ensures the data behaves as expected during analysis.
Conclusion
Effective data analysis starts long before dashboards or models are built. With the right approach to data exploration and preparation, organizations can clearly understand their data, identify meaningful patterns, and present insights with confidence. Modern BI tools make this process faster and more accessible, but results still depend on having a clear plan, the right questions, and well-prepared data.
By applying the practices discussed, understanding your data, cleaning it properly, and preparing it thoughtfully, you create a strong foundation for accurate analysis and reliable decision making.
If you want to experience this process hands-on, you can explore EzDataMunch with its free trial. It allows you to prepare, explore, and analyze your data efficiently, helping you move from raw data to business-ready insights without unnecessary complexity.
FAQ’s
What is data exploration and why is it important?
Data exploration helps understand data structure, patterns, and issues early, ensuring accurate analysis and better business decisions.
What is data preparation in data analytics?
Data preparation involves cleaning, transforming, and organizing data so it can be reliably used for analysis and predictive modeling.
What are the key benefits of data preparation?
Good data preparation improves accuracy, speeds up analysis, reduces errors, and ensures business decisions are based on trusted data.
What tools are commonly used for data exploration?
Common data exploration tools include Power BI, Tableau, Qlik, Excel, Python, and R for visual and statistical analysis.

Abhishek Sharma
Website Developer and SEO Specialist
Abhishek Sharma is a skilled Website Developer, UI Developer, and SEO Specialist, proficient in managing, designing, and developing websites. He excels in creating visually appealing, user-friendly interfaces while optimizing websites for superior search engine performance and online visibility.