
In today’s fast-paced business environment, making informed decisions is key to staying competitive. A digital dashboard serves as a powerful tool, transforming data into actionable insights and empowering businesses to operate more efficiently.
What is a Digital Dashboard?
A Digital Dashboard is an interactive interface designed to gather and consolidate data from various sources across an organization. It offers detailed business analysis while providing a real-time overview of departmental productivity, trends, activities, and key performance indicators (KPIs).
Digital dashboards are essential tools for information management, enabling users to monitor performance and make data-driven decisions. They visually represent data from multiple sources, including databases, web services, and third-party platforms, making complex information easily accessible and actionable.
In the context of Digital Marketing, a digital dashboard is often referred to as a “traffic dashboard” or “traffic dash,” as it tracks and visualizes website traffic, campaign performance, and audience behavior in real-time.
Areas Where Digital Dashboards Are Used
Digital dashboards are powerful tools for presenting diverse data from multiple sources and systems in one unified interface. In today’s digital workplace, where seamless user experience across various applications is crucial, dashboards have become indispensable. They play a pivotal role in enabling better, data-driven decision-making for managers and employees alike.
In the digital workplace, dashboards provide significant value by:
- Acting as a central entry point to access different systems.
- Streamlining processes by making hard-to-access data readily available.
- Integrating disparate data into a cohesive, single-view experience.
- Encouraging positive changes in user behavior through actionable insights.
- Communicating key organizational KPIs effectively.
- Supporting digital transformation initiatives.
With the growing volume of organizational data, businesses are increasingly turning to digital dashboards for advanced analysis, especially in industries like Retail, Banking, Insurance, and Real Estate. These dashboards enable organizations to stay competitive by leveraging real-time insights and fostering strategic decision-making.
Who uses dashboards?
Marketing Teams:
Digital dashboards empower marketing teams to monitor and measure their performance metrics seamlessly. By providing real-time insights into campaign performance, audience engagement, and lead generation, dashboards help marketers optimize strategies and make data-driven decisions. Various marketing dashboard examples illustrate the many ways they can be used effectively.
Sales Teams:
Sales are a critical and often challenging function. Sales dashboards keep sales representatives focused on their most pressing tasks and highlight immediate action items. These dashboards provide visibility into pipeline performance, target achievements, and customer insights, enabling sales teams to stay aligned and proactive.
Executive Teams:
Executives often operate under tight schedules and require quick, accurate, and real-time reports. Digital dashboards summarize and present complex data into easy-to-read, actionable insights, giving executives a clear view of profit and loss, operational performance, and strategic outcomes.
Human Resources Teams:
HR teams use dashboards to track key metrics such as employee performance, turnover rates, recruitment progress, and training effectiveness. These dashboards provide real-time insights into workforce trends, enabling HR professionals to make informed decisions about talent management and employee engagement strategies.
Operations Teams:
Operations teams rely on dashboards to monitor and manage processes, resource allocation, and production efficiency. By consolidating data from multiple systems, these dashboards help identify bottlenecks, track inventory, and ensure smooth day-to-day operations, ultimately improving overall productivity.
The key benefits of using Digital Dashboard
You’ve explored the definition and applications of a digital dashboard. Now, let’s focus on its key benefits:
Enhanced Decision-Making
Digital dashboards improve organizational performance by streamlining reporting processes, reducing data overload, and delivering targeted insights to decision-makers. They enable timely, well-informed decisions that drive success.
Real-Time Accessibility
Custom-built digital dashboards provide a live stream of information, giving top-level personnel instant access to critical data for quick responses and strategic planning.
Seamless Mobility
Digital dashboards can be tailored to individual or multiple datasets and are accessible on mobile devices and apps. This ensures you can stay informed and make decisions no matter where you are in the world.
Advanced Business Intelligence
With access to historical, real-time, and predictive analytics alongside key performance indicators (KPIs), digital dashboards significantly enhance an organization’s business intelligence capabilities.
Improved Collaboration
Digital dashboards foster collaboration by providing a centralized platform where teams can access shared data, monitor progress, and align strategies. This transparency helps eliminate silos and ensures everyone is working towards the same objectives.
Proactive Problem-Solving
By offering real-time alerts and trends analysis, digital dashboards enable organizations to identify and address potential issues before they escalate. This proactive approach helps mitigate risks and ensures smoother operations.
Digital Dashboard Examples
Digital Revenue Growth Rate
Digital Revenue Growth Rate refers to the percentage increase in revenue generated through digital channels over a specific period. It is a key metric for evaluating the effectiveness of digital strategies in driving business growth.

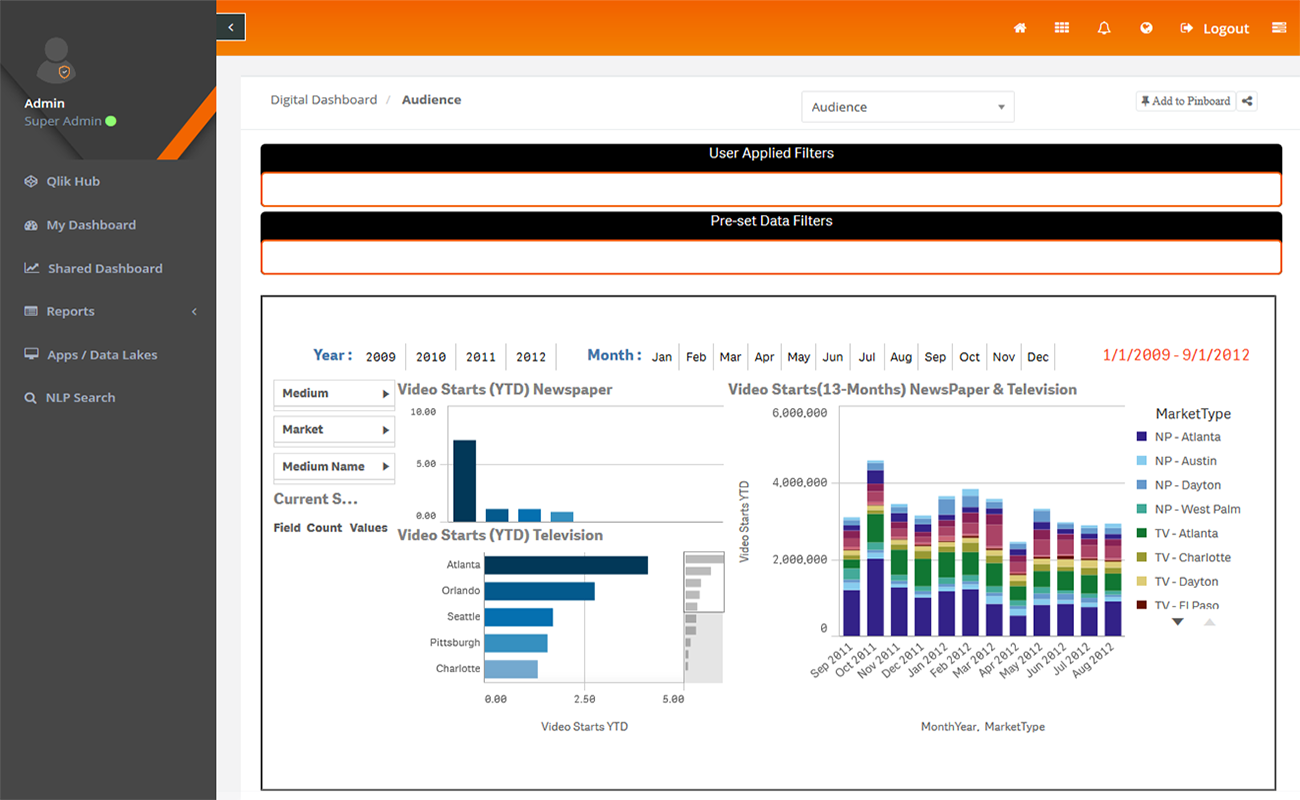
Target Audience
Target Audience refers to the specific group of people a business aims to reach with its products, services, or marketing efforts. Identifying the target audience helps tailor messaging and strategies to meet their needs effectively.
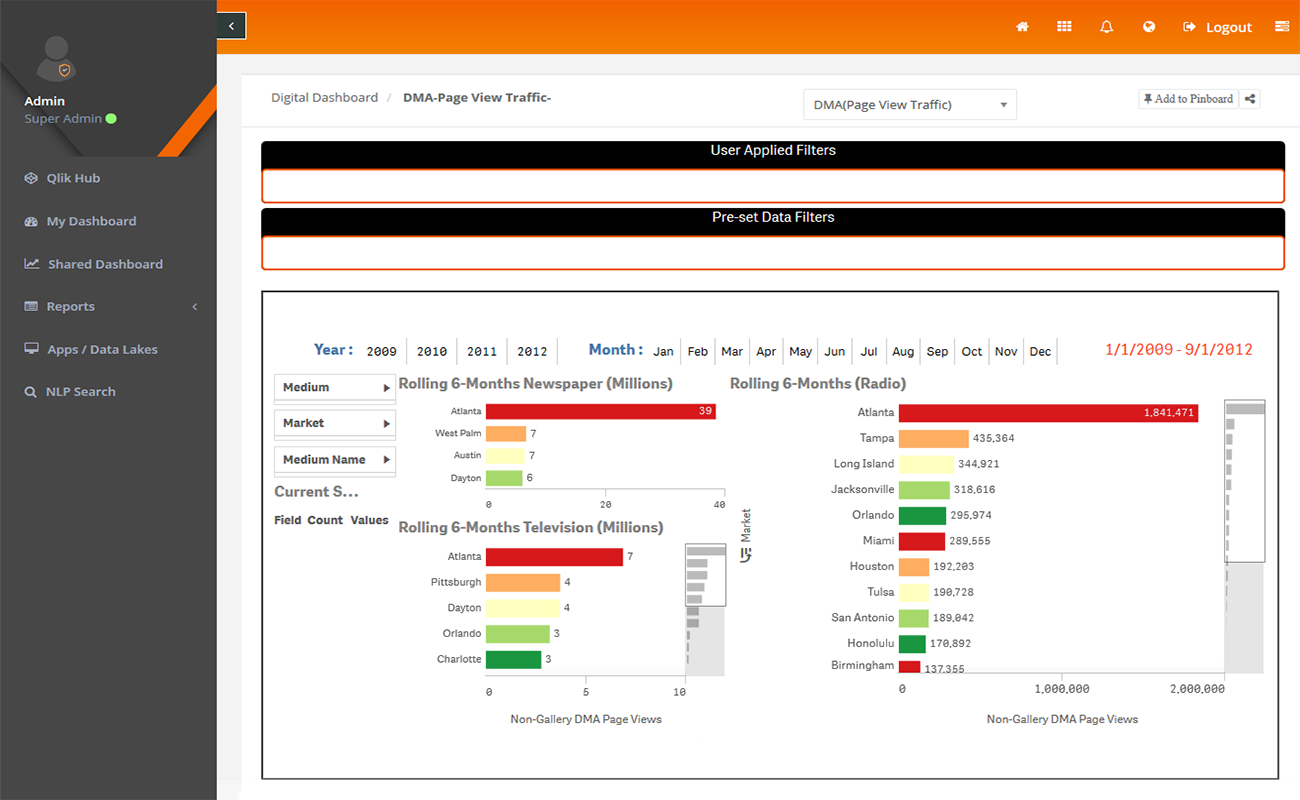
Page View Traffic
Page View Traffic measures the total number of pages viewed by visitors on a website within a specific time frame. It is a key metric for assessing website engagement and content effectiveness.
Best Practices for Designing a Digital Dashboard
Discovery Phase (Initial) – What are the specific business use cases?
The first step in designing a digital dashboard is defining its scope. During this phase, we identify the business use cases, fix design constraints, and determine data formats, types, and sizes. This foundational work ensures the dashboard is aligned with the organization’s goals and requirements.
Analysis Phase – What does the data contain?
In the Analysis Phase, our business analysts and information architects examine the data to uncover meaningful, actionable insights. This phase is heavily dependent on the information gathered in the Discovery Phase. Once we understand the data’s purpose and relevance, we move forward to the Design Phase.
Design Phase – How should the design look?
The Design Phase focuses on creating an intuitive, user-friendly layout. While content is crucial, the dashboard’s visual design plays an equally important role. Our design team collaborates with clients throughout this phase to refine the interface. Once the design meets the client’s expectations, we proceed to the Development Phase.
Development Phase – How does the design work?
Once the design is approved, the development team begins building the dashboard prototype. During this phase, we conduct thorough testing and refinement to ensure functionality aligns with the intended design. Once the dashboard passes all tests and performs seamlessly, we launch it for use.
Read More: How to define KPIs for successful Business Intelligence
FAQ’s
What is a digital dashboard and how does it benefit businesses?
A digital dashboard is a visual representation of key business metrics, providing real-time data insights. It helps businesses track performance, make informed decisions, and quickly address potential issues.
How can a digital dashboard improve decision-making in a business environment?
By presenting data in an easily digestible format, digital dashboards enable decision-makers to quickly assess trends and identify critical areas for improvement, leading to faster and more informed decisions.
What key performance indicators (KPIs) can be tracked on a digital dashboard?
KPIs like sales performance, customer satisfaction, inventory levels, website traffic, and financial metrics can be tracked on digital dashboards, providing a comprehensive view of business performance.
How can digital dashboards enhance team collaboration?
Digital dashboards provide a shared platform where team members can access up-to-date information, align on goals, and track progress together, fostering better collaboration and communication within the business.

Abhishek Sharma
Website Developer and SEO Specialist
Abhishek Sharma is a skilled Website Developer, UI Developer, and SEO Specialist, proficient in managing, designing, and developing websites. He excels in creating visually appealing, user-friendly interfaces while optimizing websites for superior search engine performance and online visibility.