Oil & Gas
Improve forecast, ensure supply as per demand, align operations with market conditions and reduce cost.
Home / Oil & Gas
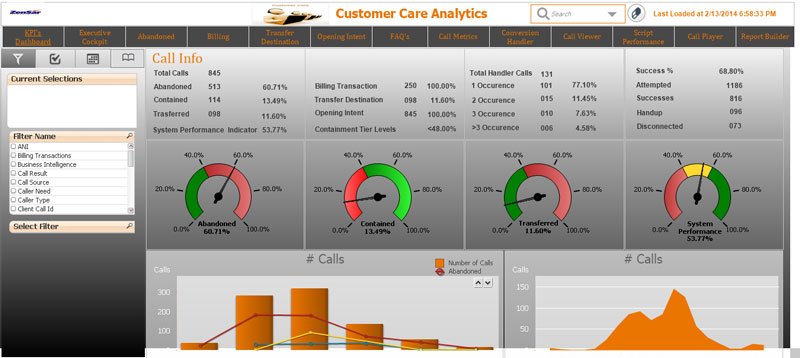
EzDataMunch’s Oil and Gas Analytics dashboards provide real-time visibility and greater insight into the key performance indicators (KPIs). Customers can use pre-built dashboards or customize the apps as per data sources, business metrics, KPIs and organizational goals. Utility dashboards are commonly used to display service volume, outages per area and consumption. Energy dashboards may display such metrics as energy consumption by plant and unit. In addition to the regular business metrics, EzDataMunch has integrated customer care analytics in our Oil and Gas analytics solutions. This App provides complete visibility into the customer interaction touch points, patterns, behavior and call volumes handled by customer care team.
Oil and Gas Analytics
EzInsights Oil and Gas Analytics helps you use your resources wisely and keep your business profitable. With our analytics solutions, you can make informed decisions to streamline operations, enhance efficiency, and adapt to market dynamics effectively. Stay ahead of the curve in the oil and gas industry with actionable insights from EzInsights.
Population is growing exponentially across the globe. This situation is creating incremental pressure on companies. Demand for energy and other utility products is also rising. Companies face immense challenge to cater to the ever increasing demand for their services.
To meet customer demand, companies must optimize resources and enhance operations. Utility companies, in particular, generate vast amounts of data daily. The adoption of smart meters and technological advancements has led to an explosion of data, creating both challenges and opportunities. When managed effectively, this data becomes a valuable asset that drives efficiency and innovation.
Public companies can unlock valuable insights by utilizing data strategically. Proper visualization not only helps in solving operational challenges but also uncovers hidden business opportunities. By leveraging data-driven decision-making, companies can enhance performance, improve customer service, and stay ahead in a competitive market.
Customer Analytics
Identify training needs, Improve customer experience & maintain profits.
Spend Analytics
Track current spend, compare budget with spend and predict future spend.

