
In today’s competitive market, retailers need actionable insights to optimize operations, enhance customer experience, and drive sales. Retail analytics dashboards help businesses track key performance indicators (KPIs) in real time, enabling data-driven decisions for growth and efficiency.
What is a Retail Analytics Dashboard?
A retail analytics dashboard is a performance and activity tracking tool that provides complete information about business operations. Retailers are always keen to monitor sales and overall business performance, and these dashboards help by consolidating crucial data in one place. By selecting the right and relevant KPIs and metrics, business owners can effectively track their performance and make informed decisions.
Why do we need Retail Dashboard?
The impact of business intelligence is increasing in retail industry and consumer good organizations. Retailers are rapidly growing their business through analytics and they are using data visualization and interactive dashboards to give value to the business.
Retailers, traders are involved to get all the benefits from the retail dashboard. This dashboard can provide your business with decision making information that can increase your business performance and sales. It is possible to move forward by taking positive feedback with retail insights data and monitoring the progress of increasing sales and managing the sales strategy according to customer behavior.
It is obvious and important work to keep track of related KPIs of retail industry like number of shop visit, shopping time, daily sales report, and inventory management. Dashboard and visualization chart are used to take a quick decision of business in less time.
Key Components of a Retail Analytics Dashboard
Below are some key components every retail analytics dashboard should include to provide a comprehensive view of business performance and support strategic decision-making.
Sales Performance Metrics – Measure revenue generation, average transaction value, and overall sales growth. Identify top-performing products and regions to guide promotions and improve sales outcomes.
Customer Insights – Analyze customer demographics, buying behavior, and loyalty trends to enhance personalization, boost retention, and shape marketing campaigns for maximum customer engagement.
Inventory Management – Track inventory turnover, stock levels, and best-selling products. Prevent overstocking or stockouts to streamline operations and reduce inventory-related costs.
Marketing Analytics – Monitor campaign performance, conversion rates, and customer acquisition costs. Understand which channels deliver results to allocate budgets and improve marketing effectiveness.
Benefits of Retail Analytics Dashboards
Below are some key benefits of using retail analytics dashboards that help retailers make smarter decisions, improve efficiency, and boost overall business performance.
Real-time Insights: Make faster and more accurate business decisions with up-to-the-minute data on sales, operations, and customer behavior to stay ahead of competitors.
Improved Customer Experience: Understand customer preferences and behavior patterns to deliver more personalized shopping experiences, boosting satisfaction and long-term loyalty.
Better Inventory Control: Avoid overstocking or stockouts to ensure the right products are available at the right time, optimizing supply chain efficiency and reducing carrying costs.
Enhanced Profitability: Identify cost-saving opportunities and revenue-generating strategies through deep financial insights and margin analysis across stores and products.
Operational Transparency: Gain a clear view of store performance, employee productivity, and key processes to identify bottlenecks and improve efficiency across all retail functions.
Data-Driven Forecasting: Use historical and current data to accurately predict trends, demand, and inventory needs, ensuring better planning and reduced financial risk.
How can retailers use data visualization for better results?
Below are some powerful dashboards that help retailers visualize key data for better decision-making. Each dashboard offers in-depth insights to drive business growth and long-term success.
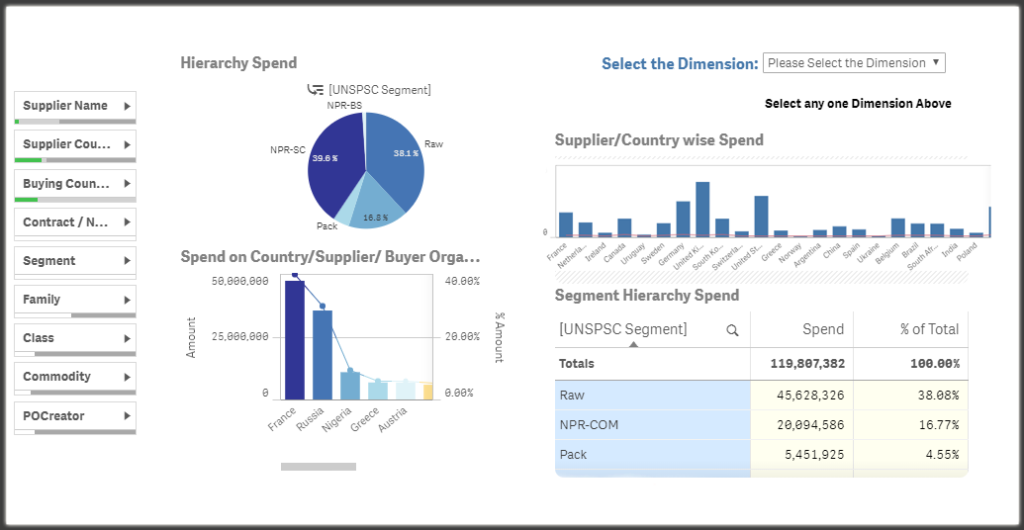
Market Analysis
Retailers can uncover new market opportunities driven by marketing efforts at every level. These dashboards help measure campaign impact and evaluate the effectiveness of each marketing initiative in real time.
Retail Operations
This dashboard provides real-time insights by integrating data from POS systems and other operational sources. It empowers retailers to make quick and informed decisions related to sales, inventory levels, and workforce management. It helps ensure smooth day-to-day operations and improves overall store efficiency.

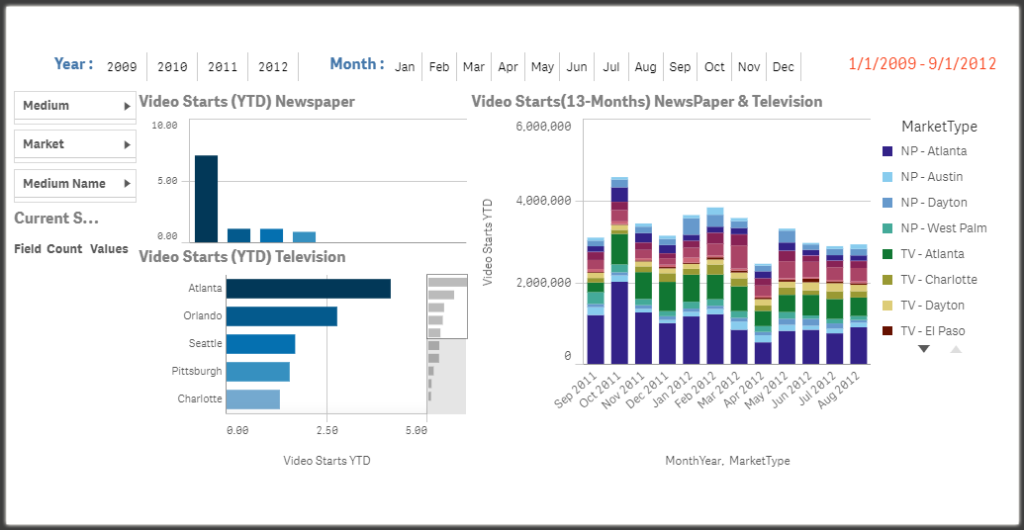
Digital Marketing Analysis
A Digital Marketing Analysis dashboard helps track the effectiveness of campaigns in real time, providing valuable insights into performance across channels. It allows retailers to monitor ongoing campaigns, evaluate the marketing mix, and understand where time and budget are being spent. This insight helps in defining more effective strategies and maximizing return on investment (ROI).
Customer Analytics
Customer analytics is the process of understanding customer behaviour, preferences, and interactions with your brand. By analysing data such as purchase history, social media engagement, and predictive trends, retailers gain a deeper understanding of each customer. These insights enable businesses to personalize experiences, build stronger relationships, and foster long-term brand loyalty.

Retail Performance Metrics to Track
Retail KPIs (Key Performance Indicators) are measurable values that help retailers track and evaluate the effectiveness of their operations. These metrics provide clear insights into sales performance, customer behavior, inventory management, and overall store efficiency. By analyzing these KPIs, retailers can identify buying patterns, streamline ordering and shipping processes, and ultimately drive profitability.
Here is a list of some of the most important retail KPIs and metrics that help businesses make smarter, data-driven decisions:
- Sales & Gross Margin – Measure total revenue and profitability after deducting the cost of goods sold.
- Sales per Square Foot – Evaluate how effectively retail space is being utilized to generate revenue.
- Average Customer Spend – Track how much each customer spends on average during a visit or transaction.
- Stock Turnover Rate – Indicates how often inventory is sold and replaced within a given period.
Conclusion
A well-designed retail analytics dashboard provides a comprehensive view of key business operations, enabling retailers to make data-driven decisions that boost efficiency and profitability. By tracking essential KPIs, retailers can optimize sales, enhance customer experiences, and streamline operations for sustained growth. Investing in the right analytics tools is crucial for staying competitive in today’s dynamic retail landscape.
Ready to unlock the full potential of your retail data?
Register with EzDataMunch for a free trial and start making smarter decisions with powerful retail analytics dashboards.
FAQ’s
What is the purpose of a retail analytics dashboard?
A retail analytics dashboard helps track, visualize, and analyze key performance indicators (KPIs) in real time, enabling retailers to make informed decisions and improve business performance.
Which KPIs should retailers prioritize?
Retailers should focus on KPIs like sales revenue, average transaction value, customer lifetime value, stock turnover rate, and conversion rate to gain comprehensive insights into their operations.
How does retail analytics improve customer experience?
By analyzing customer behavior, preferences, and purchase history, retailers can personalize offers, improve service quality, and deliver a seamless shopping experience across all channels.
Can small retail businesses benefit from analytics dashboards?
Yes, even small retailers can use analytics dashboards to gain visibility into operations, identify growth opportunities, and optimize inventory, marketing, and customer engagement strategies.

Abhishek Sharma
Website Developer and SEO Specialist
Abhishek Sharma is a skilled Website Developer, UI Developer, and SEO Specialist, proficient in managing, designing, and developing websites. He excels in creating visually appealing, user-friendly interfaces while optimizing websites for superior search engine performance and online visibility.