
In today’s fast-moving business environment, intuition alone is no longer enough. CEOs are expected to make high-impact decisions faster, with greater accuracy, and under constant pressure from markets, boards, and customers. This is where Business Intelligence (BI) becomes more than a reporting tool and it becomes a leadership advantage.
When used correctly, BI helps CEOs see the full picture of their organization, connect strategy to execution, and drive measurable performance across teams.
What is Business Intelligence?
Business Intelligence (BI) is the process of transforming raw data into meaningful insights that drive profitable business actions. It helps organizations convert scattered data from multiple sources into clear, actionable information that supports better decision-making.
Using BI tools, raw input files are processed, analyzed, and converted into valuable output such as reports, dashboards, and visualizations so that executives and managers can use to guide business growth.
Business Intelligence enables executives, managers, and corporate teams to:
- Understand what is happening across the business
- Identify trends and patterns
- Make informed, data-driven decisions
BI includes a combination of tools, applications, and software that allow organizations to collect data from internal systems (ERP, CRM, finance, operations) and external sources, prepare it for analysis, run queries, and present insights through dashboards, charts, graphs, and reports.
Instead of relying on assumptions or delayed reports, BI provides a clear, real-time view of business performance.
Why Business Intelligence are important for business?
Business Intelligence delivers value to organizations of all sizes like from startups to large enterprises. When implemented correctly, BI helps businesses operate more efficiently, grow revenue, and stay ahead of competitors.
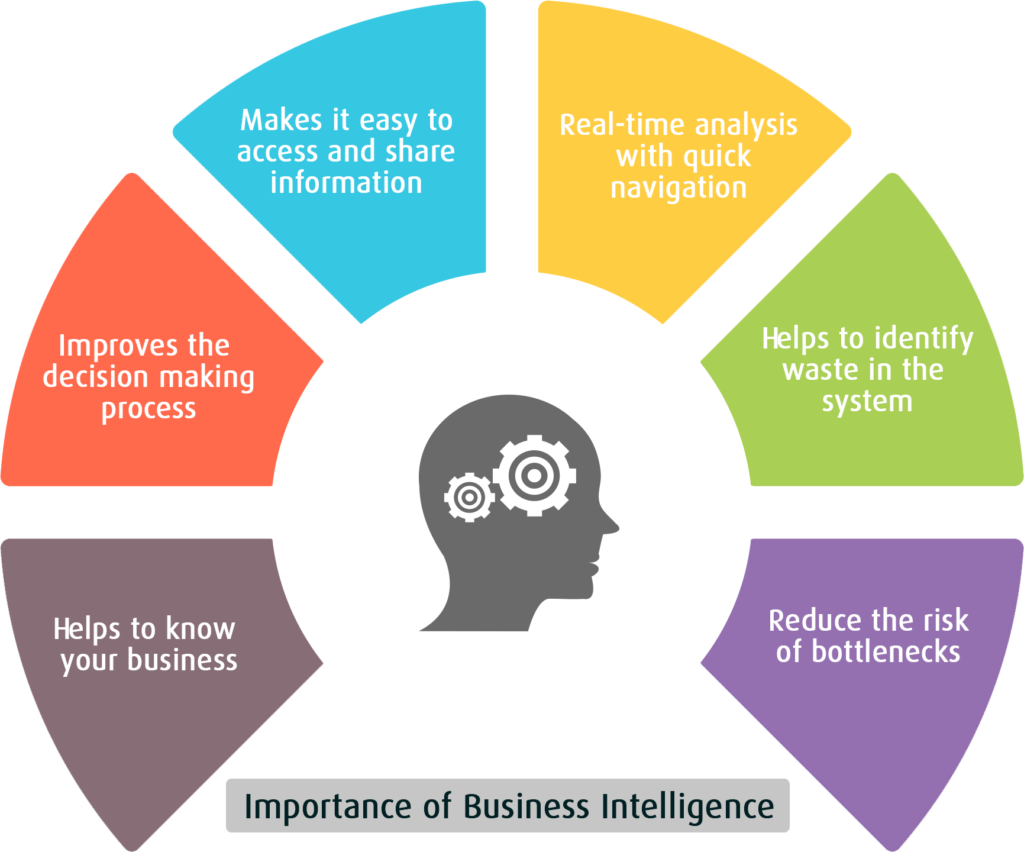
Some key benefits of BI include:
- Optimizing internal business processes
- Improving operational efficiency
- Identifying new revenue opportunities
- Gaining a competitive advantage
- Detecting market trends and business risks early
BI systems typically combine historical data from data warehouses with real-time data from operational systems. This allows BI tools to support both strategic decisions (long-term planning) and tactical decisions (day-to-day operations).
How BI Helps Organizations:
- Create KPIs based on historical and real-time data for accurate decision-making
- Improve data quality and clarity through visualizations
- Support both large enterprises and small to medium-sized businesses
What CEOs Want—and Need—to Know from Business Intelligence
Many organizations invest in BI dashboards but fail to get real value from them. The reason is simple: they track the wrong metrics.
If dashboards do not answer real business questions, they become noise instead of insight.
CEOs need dashboards that provide a clear, complete picture of business performance when they need it. Metrics must be chosen carefully, aligned with business goals, and easy to understand.
CEOs should stop publishing dashboards that do not answer critical questions and instead focus on dashboards that can answer these questions anytime, anywhere.
Key Areas CEOs Track Through BI
Financials
- Are we over or under budget?
- Which departments are overspending or underspending?
- How are margins trending?
Goals & Objectives
- Are we on track to meet our business goals?
- Are deadlines being met?
Planning vs. Actuals
- Are projects ahead or behind schedule?
- Will we meet our committed delivery dates?
Headcount & Resources
- Do we have enough resources to meet objectives?
- Do we have the right skills in place?
Comparisons & Performance
- Which regions, teams, or products are performing better?
- Why is one area outperforming another?
Why CEOs Need Business Intelligence
CEOs need instant visibility into critical business data like purchases, inventory, sales, payments, and customer behavior without waiting for manual reports.
Business Intelligence provides insights and trends that help CEOs:
Scale operations
Improve performance
Make faster, smarter decisions
Top Benefits of BI for CEOs
Cost Reduction
BI helps identify inefficiencies, unnecessary expenses, and areas where productivity can be improved with leading to cost savings and higher profitability.
Improved Efficiency and Productivity
With BI, CEOs can see where processes slow down and where resources are underutilized, enabling targeted improvements across teams.
Better Decision-Making
BI and predictive analytics support data-driven decisions related to:
Customer segmentation
Customer lifetime value
Cross-sell and upsell opportunities
Win–loss analysis
CEOs get the right information at the right time.
Sales Growth
BI improves sales performance by analyzing:
Buying patterns
Sales trends
Inventory and distribution efficiency
This leads to better demand planning and improved revenue outcomes.
Opportunity Identification
BI helps organizations to spot market opportunities early before competitors do. It provides insights into customer behavior and future demand, enabling proactive decision-making.
What Information Should a CEO Dashboard Include?
A CEO dashboard should provide a panoramic view of the organization. Its purpose is not to overwhelm with data, but to highlight what truly matters.
To build an effective CEO dashboard, it is essential to understand what information should be included.
Selecting the Right KPIs and Metrics
Choosing the right KPIs is the most critical step in building a successful dashboard. Poor KPI selection can make even the best-designed dashboard useless.
Before creating a dashboard:
- Clearly define business goals
- Align KPIs with strategic objectives
- Involve senior leadership where needed
Dashboards should be planned carefully, as future decisions depend on them.
Effective Design and Visualizations
Once KPIs are finalized, the next step is designing the dashboard. Each KPI should use the most appropriate visualization based on the data type.
Good dashboard design:
- Makes insights easy to understand
- Reduces cognitive load
- Highlights trends, not just numbers
Different KPIs require different charts like line charts, bar charts, tables, or gauges depending on the data.
A Unified View Across Departments
From a CEO’s perspective, all critical information should be accessible in one place.
A strong BI dashboard integrates:
- Management data
- Marketing performance
- Financial metrics
- Sales and operations data
This unified view allows CEOs to quickly understand overall business health and make informed decisions.
Example: BI in Action
Consider a tire retail business. Using BI dashboards, the CEO can:
- Track invoice units
- Monitor order and shipment status
- Analyze net sales by day and channel
- Manage inventory and delivery performance
All this information is available in real time, on a single dashboard.
Performance Dashboard
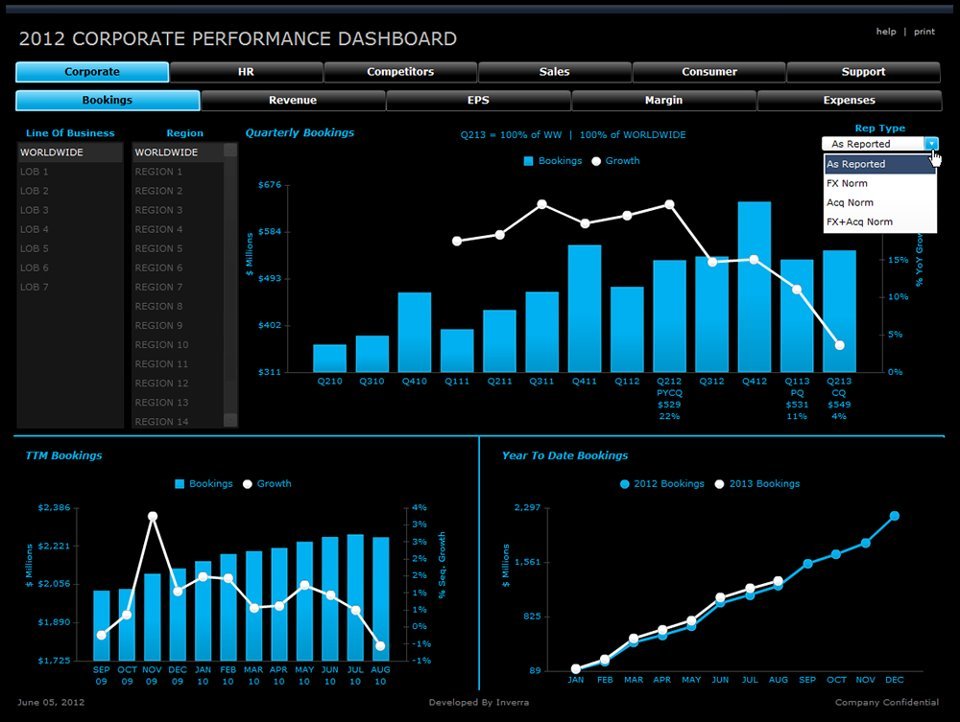
A performance dashboard provides a comprehensive snapshot of the organization. It may include insights related to:
HR and workforce metrics
Competitor performance
Sales and revenue
Customer behavior
Margins and expenditures
Filters allow CEOs to quickly drill down into specific areas based on their priorities.
Key KPIs for a CEO Dashboard
CEOs need real-time visibility to make timely decisions. Common KPIs include:
Revenue – Total income generated from business operations during a specific reporting period.
Revenue Growth – Percentage increase in revenue compared to previous periods or benchmarks.
Gross Profit – Revenue remaining after deducting direct production or service delivery costs.
Average Gross Margin – Average profitability percentage indicating cost efficiency across products or services.
Operating Income – Earnings generated from core business activities before interest and taxes.
Cumulative Sales – Total sales accumulated over time, showing long-term revenue performance trends.
Total Leads by Revenue – Revenue contribution generated from qualified leads across sales channels.
Orders – Total number of confirmed customer purchase requests received within a period.
Inventory Turnover – Measures how quickly inventory is sold and replaced over time.
Stock Availability – Percentage of products available to meet customer demand without delays.
Customer Service Issues – Number of reported service problems impacting customer satisfaction and retention.
Returns – Quantity or value of products returned by customers after purchase.
Performance Reviews – Evaluation of employee performance against defined goals and expectations.
Dealer Satisfaction – Measures dealer experience, loyalty, and satisfaction with company operations.
Employee Engagement – Level of employee commitment, motivation, and involvement in organizational goals.
Customer Complaints – Number of customer-reported issues indicating service or product quality problems.
CEO’s Dashboard Examples
Provides a high-level view of organizational performance, strategy progress, risks, and real-time decision-making insights.
CIO Executive Summary Dashboard
Summarizes IT performance, system availability, cybersecurity risks, technology investments, and alignment with business objectives.
Financial Performance Dashboard
Tracks revenue, expenses, profitability, cash flow, budget variance, and financial health across business units.
CEO Dashboard
Delivers real-time insights into revenue, growth, operations, risks, and strategic goal achievement organization-wide.
Business Management Dashboard
Monitors operations, sales, workforce productivity, customer metrics, and overall business efficiency using the best sales graphs in one unified view.
Final Thoughts
Business Intelligence empowers CEOs to move from reactive management to proactive leadership. With the right KPIs, intuitive dashboards, and reliable data, BI becomes a powerful tool to drive performance across the organization.
As digital transformation continues to evolve, BI dashboards will play an even greater role in helping CEOs consistently meet—and exceed—their business goals.
Experience this impact firsthand with EzDataMunch. Start your free trial and see how real-time insights can transform decision-making across your organization.
FAQ’s
What is the main purpose of a CEO dashboard?
A CEO dashboard provides real-time visibility into key business metrics, enabling faster, data-driven strategic decisions.
How is a CEO dashboard different from operational dashboards?
CEO dashboards focus on high-level KPIs and trends, while operational dashboards track detailed, day-to-day activities.
How often should CEO dashboards be updated?
Ideally, CEO dashboards should update in real time or near real time to support timely decision-making.
What industries benefit most from CEO dashboards?
All industries benefit, including healthcare, banking, retail, manufacturing, logistics, and technology-driven enterprises.

Anupama Desai
President & CEO
Anupama has more than 23 years of experience as business leader and as an advocate for improving the life of the business users. Anupama has been very active in bringing business perspective in the technology enabled world. Her passion is to leverage information and data insights for better business performance by empowering people within the organization. Currently, Anupama leads Winnovation to build world class Business Intelligence application platform, and her aim is to provide data insights to each and every person within an organization at lowest possible cost.