In today’s data-driven world, businesses generate massive amounts of information every day. But raw data is valuable only when it is easy to understand and act on. That is where a data dashboard becomes essential. A well-designed dashboard helps teams track performance, analyze metrics, and take real-time decisions all in one place.
In this blog, we will explain what a data dashboard is, how dashboard charts work, why it matters in Business Intelligence (BI), and the major benefits of using a data dashboard in any organization.
What is Data Dashboard?
A data dashboard is a data management tool that provides centralized access to key business information, enabling efficient monitoring, measurement, and analysis of performance. It brings together relevant data sets and presents them through clear visual representations such as charts, graphs, and tables.
Modern businesses use multiple data sources, and a dashboard offers a unified way to manage them all. It consolidates information from different systems and delivers a single, comprehensive view of business activities. This helps users monitor performance, identify trends, and make informed decisions.
With real-time data analysis, dashboards reduce time spent on manual reporting and eliminate confusion caused by scattered or unstructured data. As a result, users gain faster insights and a better understanding of how the business is performing.
Working of a Data Dashboard in Business Intelligence
A data dashboard functions differently across various departments within an organization. Before building one, it is important to understand that the design of the dashboard depends entirely on the role it serves. Different teams access different data sources, so each user views the dashboard uniquely based on their responsibilities and requirements.
In Business Intelligence (BI), a dashboard works by collecting data from multiple advertising, marketing, sales, finance, and operational platforms. These connections are made using pre-configured instant connectors and API integrations. Once configured, BI tools transform this raw data into visualizations and design dashboards that can be used for reporting, analysis, and decision-making that is based on the needs of clients, teams, or leadership.
What Can Data Dashboards Provide?
A well-designed data dashboard can help you:
- Monitor marketing campaign performance
- Identify issues in paid ads or underperforming channels
- Track keyword performance for content marketing
- Access a comprehensive company overview with in-depth insights
- Improve sales management and productivity with sales reporting techniques
- Reduce manual effort through automated reporting
In Summary: How Dashboards Support BI
Measuring Performance
Dashboards allow you to define and track KPIs for each department. This makes it easy to measure business performance, identify gaps, and drive overall business success.
Forecasting
One of the most valuable features of BI dashboards is their ability to predict future trends. Predictive analytics help businesses plan initiatives, forecast revenue, and shape long-term strategy.
Actionable Insights
Dashboards provide users with complete, real-time information right at their desk. Weekly and monthly reports also improve efficiency by eliminating manual analysis.
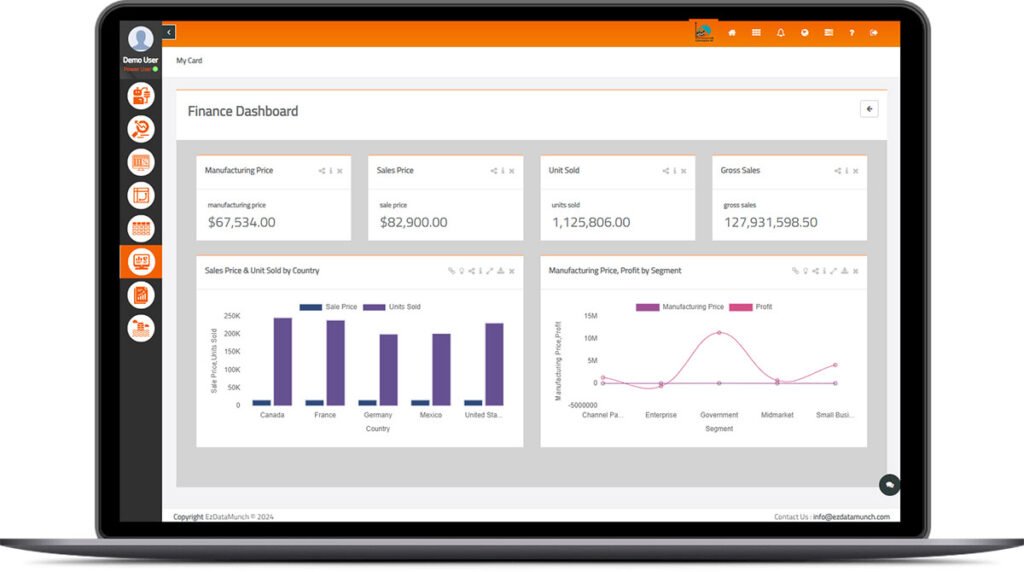
Simplifying Complex Data
Dashboards display information through intuitive visual elements such as:
- Line graphs
- Bar charts
- Pie charts
- Scatter plots
- KPI cards
These visuals make complex data easier to understand and help users make data-driven decisions quickly.
Benefits of Creating Data Dashboard
From the above sections, you now have an overview of what a data dashboard is and how it supports Business Intelligence (BI). Now let us explore the key benefits of using a data dashboard in any organization.
Easy Customization
A well-designed dashboard should be easily customizable based on your needs. One of the biggest advantages dashboards have over traditional spreadsheets is their flexibility and they can be tailored to show exactly the metrics, charts, or KPIs you want. This makes them highly adaptable for different teams and business goals. You can also learn dashboard design best practices for more efficient customization.
Real-Time Monitoring
If you are still relying on traditional analytics reports, sending them to different teams, and waiting for responses, you may be slowing down your decision-making process. In today’s fast-moving business environment, real-time monitoring is essential. Dashboards allow organizations to make quick, informed decisions by showing live data instantly.
Predictive Insights
A data dashboard not only shows what is happening now but also helps forecast what might happen next. By analyzing trends, metrics, and patterns, dashboards provide predictive insights that guide strategic decision-making. If you do not like the default layout, digital dashboards allow you to select only the required fields and customize or publish them based on your preference.
Supports Multitasking
Managing multiple tasks manually can be time-consuming and inefficient. Dashboards simplify multitasking by gathering all important data in one place. This gives businesses the ability to track various activities simultaneously whether it is sales, marketing, finance, or operations without switching between systems.
What KPIs and Metrics are tracked using Data Dashboard?
The first step in designing an effective dashboard is to identify the KPIs (Key Performance Indicators) and metrics that matter most to your business. It is best to categorize these KPIs by department or business function before building the dashboard. This ensures that the dashboard directly supports the needs of the team and contributes to overall business goals.
One of the greatest strengths of dashboards is their flexibility. They can be used in any industry or department including sales, executive management, marketing, healthcare, retail, and supply chain. Below are some commonly used dashboards and the types of KPIs they track.
Marketing Dashboards
Marketing dashboards help track and improve the performance of digital marketing activities. Whether it is SEO performance, social media growth, website traffic, or campaign insights, everything can be monitored in one place.
By selecting meaningful KPIs and metrics, marketing teams can boost overall performance and optimize their strategies. Since marketing involves multiple channels and activities, it is essential to monitor real-time performance and track progress using the right digital marketing KPIs. These KPIs may vary across companies, so proper planning is important before implementing them. Marketing teams can optimize strategy using marketing reporting templates.
Executive Dashboards
Executive dashboards provide high-level, summarized information from all departments in the company. This helps executives quickly understand overall business productivity and performance.
Using these dashboards, leadership teams can:
- Monitor key business metrics
- Track departmental progress
- Identify opportunities or risks
- Make strategic, data-driven decisions
Executive dashboards act as a central hub of insights for top-level decision-makers. Executives can also access financial reporting insights for smarter planning.
Sales Dashboards
Sales dashboards help sales managers measure:
- Key sales metrics
- Individual and team performance
- Lead conversions
- Sales activities and pipeline
They also allow comparisons between:
- Current vs. previous year’s sales
- Growth rates
- Actual performance vs. sales targets
With real-time insights, sales teams can stay aligned, track progress, and optimize their strategy to achieve targets. Dashboards improve accuracy using data quality metrics.
Data Dashboard Examples for Different Industries
Data dashboards are versatile and can be tailored to meet the unique needs of any industry. By tracking industry-specific KPIs, organizations gain real-time insights, improve operational efficiency, and make smarter business decisions. Below are some powerful examples of dashboards used across various sectors.
Manufacturing Production Dashboard
A manufacturing dashboard supports operational excellence by providing real-time visibility across production processes, supply chain activities, and market demand. With key manufacturing metrics, businesses can measure:
- Machine performance
- Production volume
- Equipment efficiency
- Sales revenue
- Downtime and defects
These insights help manufacturers optimize output, reduce operational costs, and maintain consistent product quality.
Logistics & Transportation Dashboard
A logistics transportation dashboard helps companies enhance supply chain operations and reduce overall costs. By using this dashboard, organizations can:
- Monitor fleet and vehicle performance
- Track shipment status and delivery timelines
- Identify supply chain bottlenecks
- Improve route planning
- Ensure on-time delivery
This enables logistics teams to streamline operations, boost customer satisfaction, and achieve higher operational efficiency.
Hospital KPI Dashboard
In the healthcare sector, data dashboards play a crucial role in improving patient care and operational management. Hospitals can use dashboards to:
- Increase revenue through better patient experience
- Track performance across multiple branches
- Reduce operational and administrative costs
- Manage workforce availability based on seasonal demand
- Track marketing and outreach effectiveness
A hospital KPI dashboard is essential for gaining insights, reducing mortality rates, optimizing resource allocation, and ensuring smooth communication across departments.
Retail Dashboards
Monitor store performance, inventory, and sales trends to improve overall retail strategy. Retail teams can also check retail analytics dashboards for reference.
Ready to design data dashboard for your specific industry with your data set?
From the above discussion, you can clearly understand the power of data dashboards in transforming business performance. If you are ready to get started, EzDataMunch provides everything you need to unlock insights from your data.
With EzDataMunch, you can build intuitive, interactive, and fully customizable dashboards tailored to your industry and business goals. Whether your data is simple or highly complex, our platform helps you visualize it effortlessly and make smarter decisions.
Simply sign up and take advantage of the EzDataMunch free trial demo to experience the full power of your data in action.
FAQ’s
What is a data dashboard?
A data dashboard is a visual tool that displays key metrics and insights in real time, helping businesses monitor performance and make data-driven decisions.
Why are data dashboards important for businesses?
Dashboards centralize information from multiple data sources, reduce manual reporting, and provide instant visibility into performance, trends, and issues.
What types of KPIs can be tracked using dashboards?
You can track marketing KPIs, sales metrics, financial indicators, operational performance, customer analytics, and executive-level business summaries.
Can dashboards be customized for different industries?
Yes, dashboards are fully customizable. They can be designed for industries like manufacturing, logistics, healthcare, retail, finance, and more—based on specific KPIs and business goals.

Abhishek Sharma
Website Developer and SEO Specialist
Abhishek Sharma is a skilled Website Developer, UI Developer, and SEO Specialist, proficient in managing, designing, and developing websites. He excels in creating visually appealing, user-friendly interfaces while optimizing websites for superior search engine performance and online visibility.